Supercharge Your Day Trading
Explore our powerful custom indicators designed to enhance your trading precision. From identifying critical intraday levels to analyzing market inefficiencies, our indicators provide the tools you need to make informed trading decisions.


Unlock Your Trading Edge
Enhance, Automate, Optimize
Take your trading to the next level with Steady Turtle Indicators. Identify crucial market levels with precision, automate complex analysis for faster decision-making, and customize your strategy for maximum profitability. Our tools are designed to give you a competitive edge, helping you navigate markets with confidence and efficiency.
- Pinpoint Market Levels with Precision
-
Our indicators are designed to help you identify crucial market levels, such as fair value gaps, session highs, and lows. By marking these levels accurately, you gain deeper insights into market behavior, allowing you to make informed trading decisions with confidence.
- Automate Complex Analysis
-
Eliminate guesswork and manual calculations. Our indicators automate intricate market analysis, enabling you to react swiftly to market changes. This automation ensures you stay ahead of the curve, focusing on strategy execution rather than analysis.
- Customize for Maximum Profitability
-
Every trader is unique, and so is our suite of indicators. Tailor them to suit your specific trading style and strategy, optimizing your approach for the highest profitability. Adapt to any market condition with tools that grow with your trading needs.
Testimonials
What Traders Are Saying
"The Inverse Fair Value Gap Indicator has completely transformed my trading strategy. It's amazing how clearly it marks out market inefficiencies and highlights potential reversal points. I've seen a noticeable improvement in my trade entries and exits."
"I've always struggled with understanding the impact of overnight trading on the regular session, but the Overnight Sessions Indicator has been a game-changer. It gives me clear insights into session highs and lows, helping me plan my trades with more confidence."
"The Intraday Levels Indicator has quickly become a must-have in my trading toolkit. It marks all the crucial levels like ADR, pivot points, and previous session highs and lows with precision. Now, I can identify key support and resistance zones at a glance!"
"The Open Range Indicator is perfect for my trading style. By marking the high, low, and midpoint of the opening hour, it has helped me understand market sentiment right from the start. I've been able to time my trades more effectively and capture better opportunities."
"This indicator does an excellent job of identifying fair value gaps that I would have otherwise missed. The color change feature when gaps are inversed is especially helpful—it gives me the visual confirmation I need to act quickly and confidently."
"The Overnight Sessions Indicator has helped me understand the market's overnight activity better than ever before. It's like having a roadmap for the day ahead, allowing me to spot key levels and plan my trades accordingly. My performance has definitely improved since using it."
"I've been using the Open Range Indicator for a few weeks now, and it's been a fantastic addition to my trading tools. The clear visual cues it provides during the first hour of trading have helped me catch some great moves. It's become a staple in my daily routine."
Identify and Exploit Market Inefficiencies with Precision
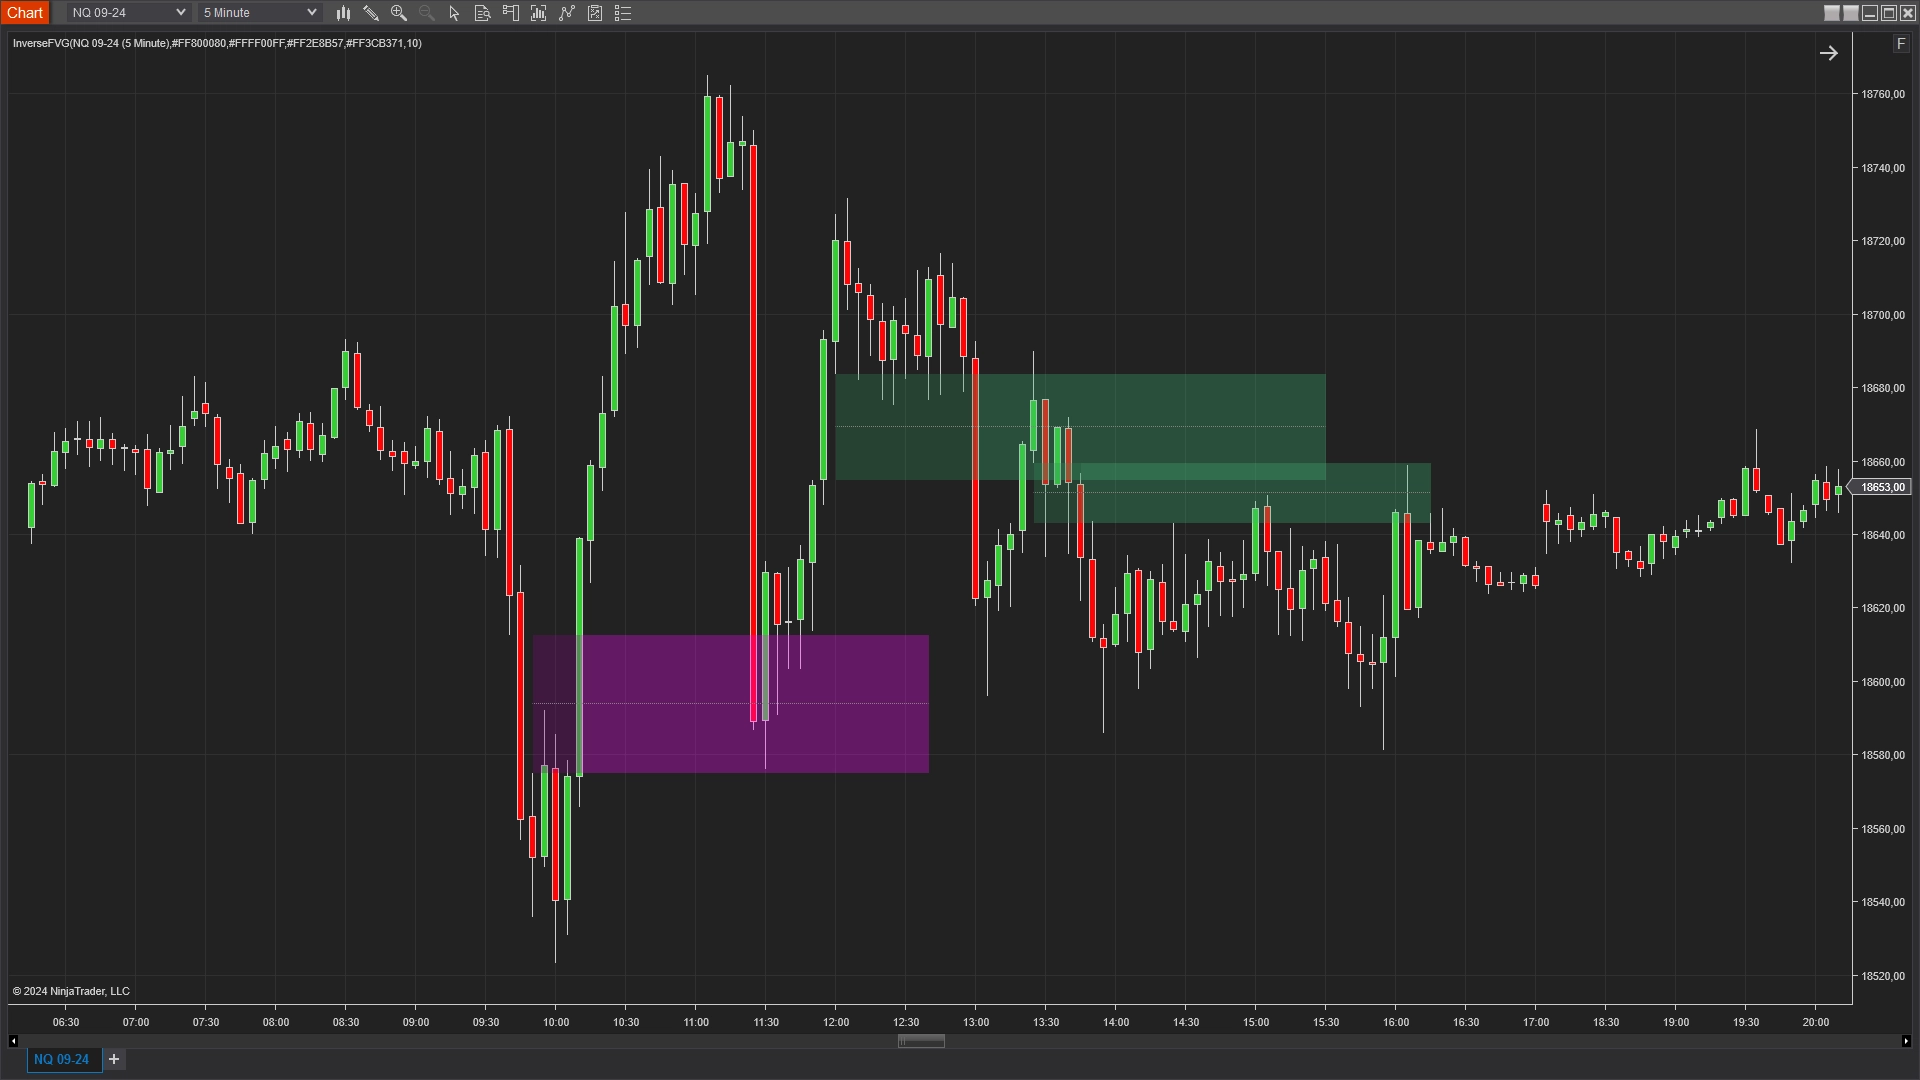
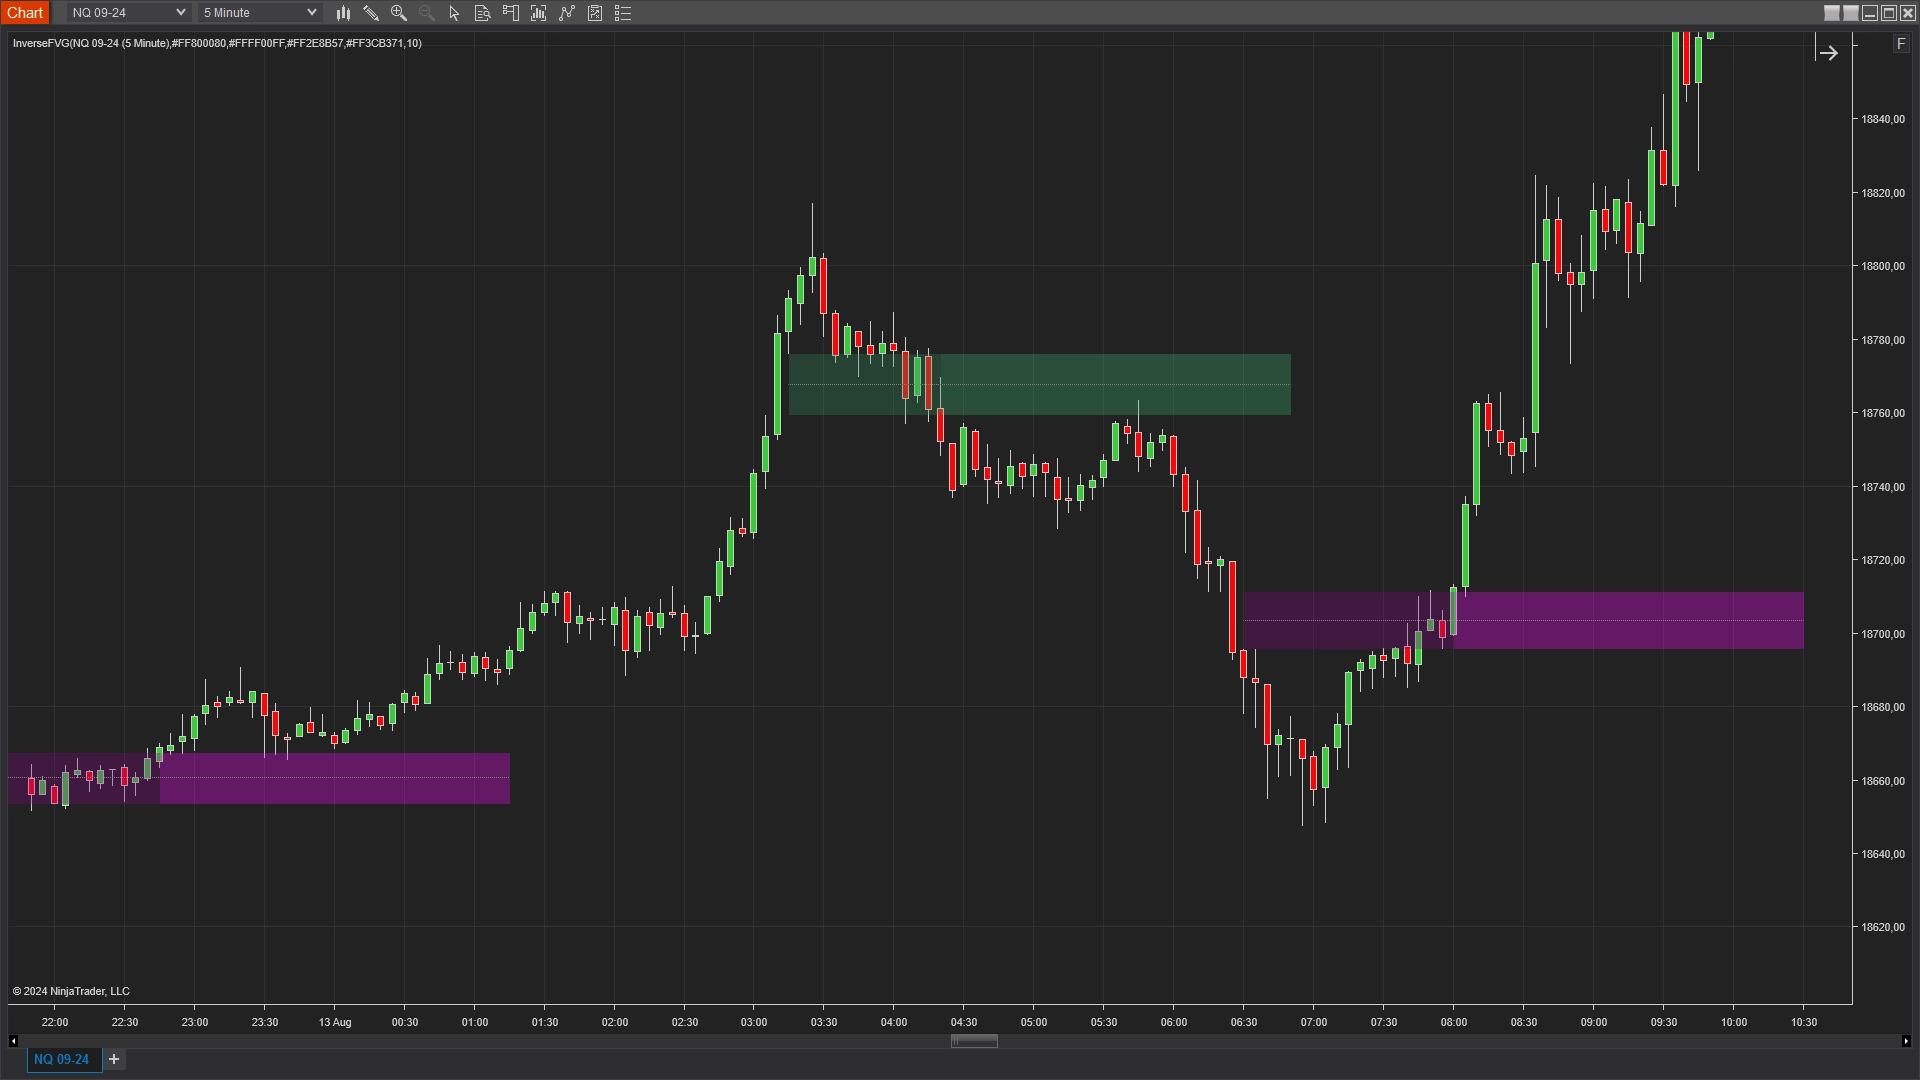
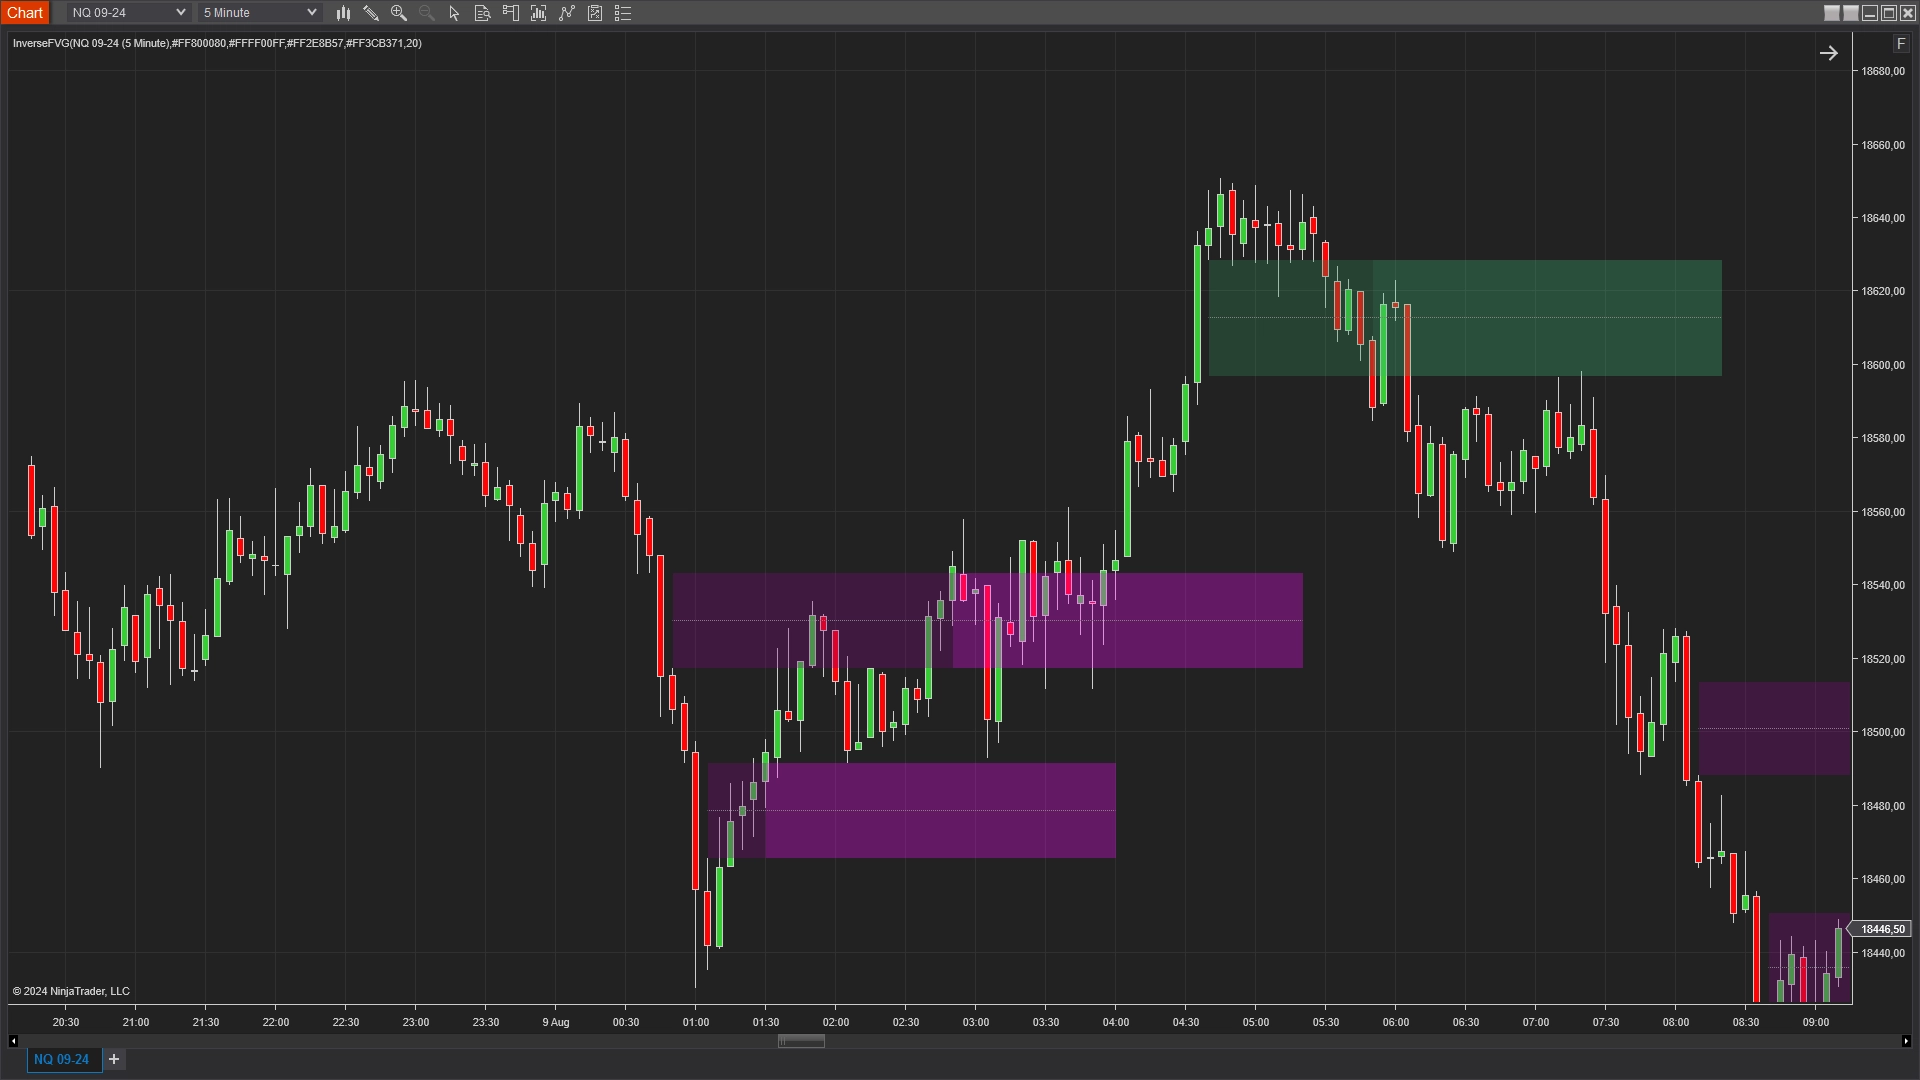
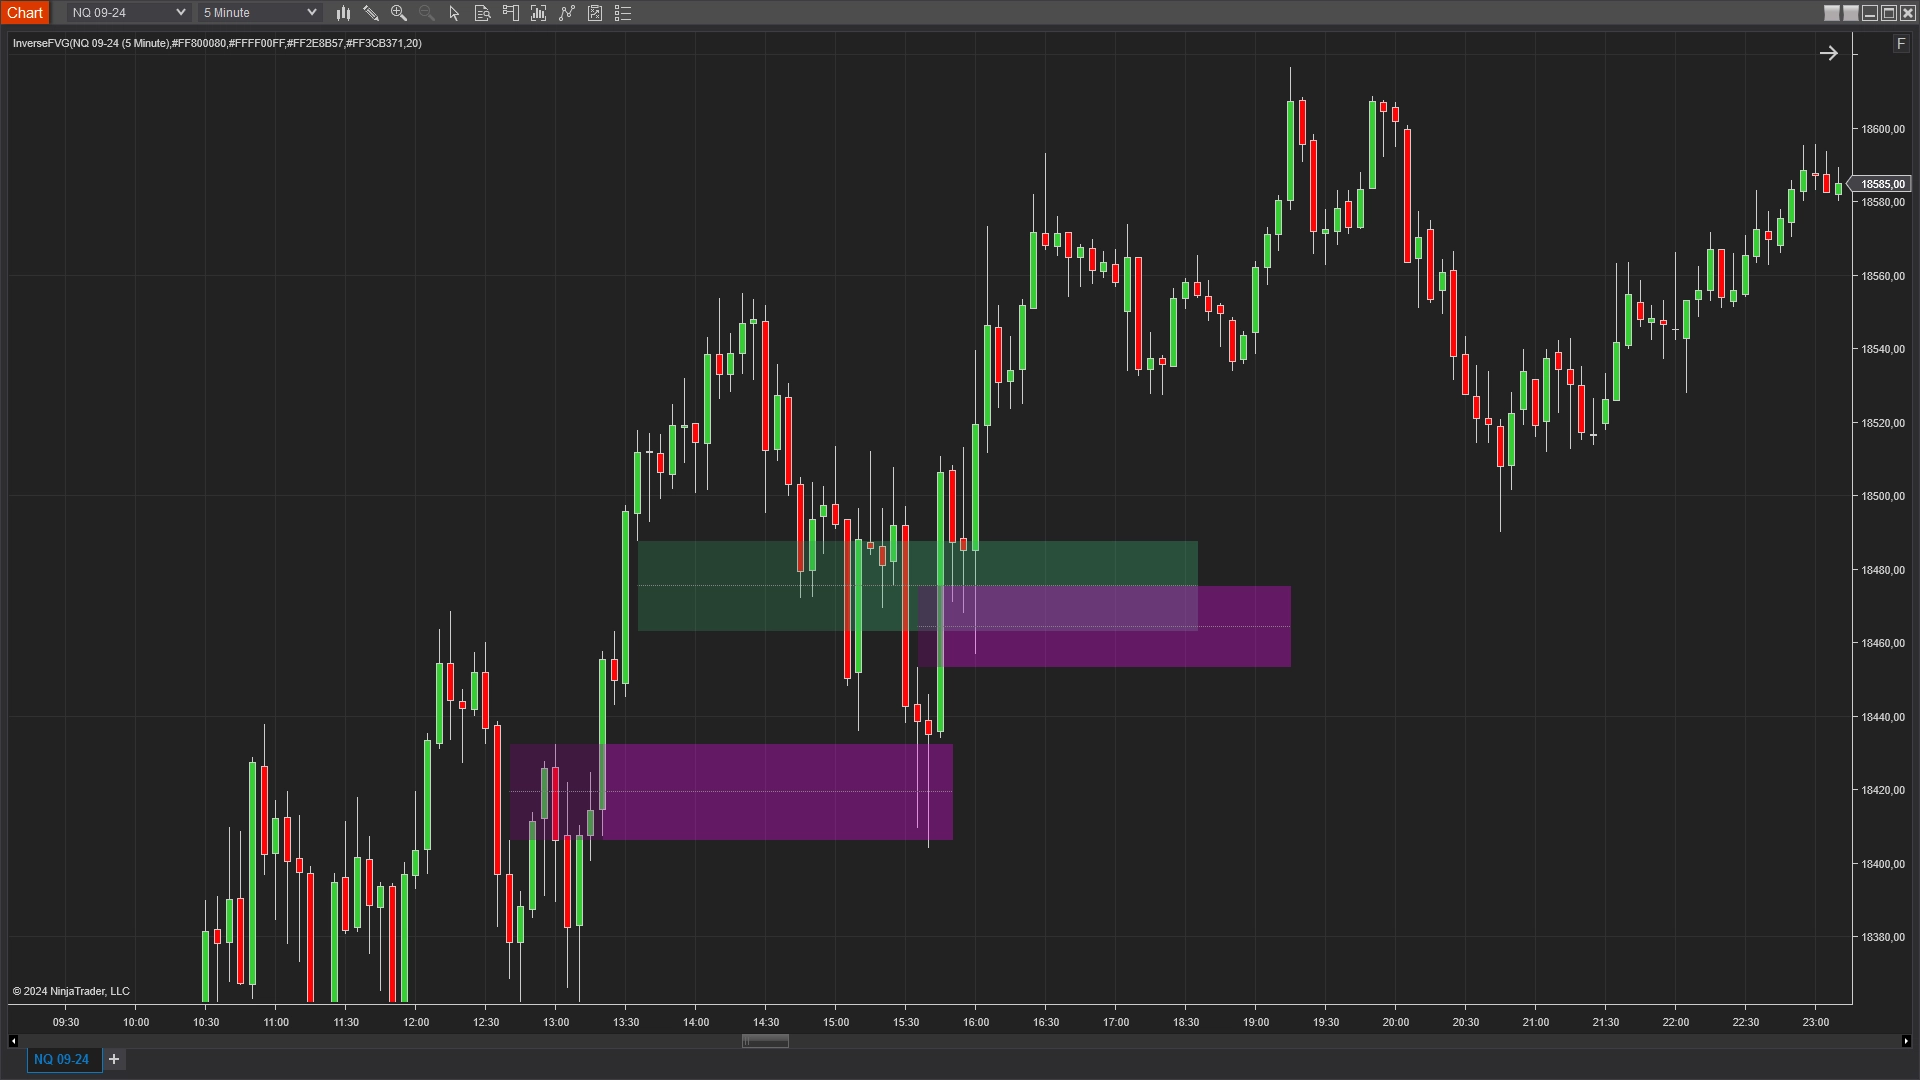
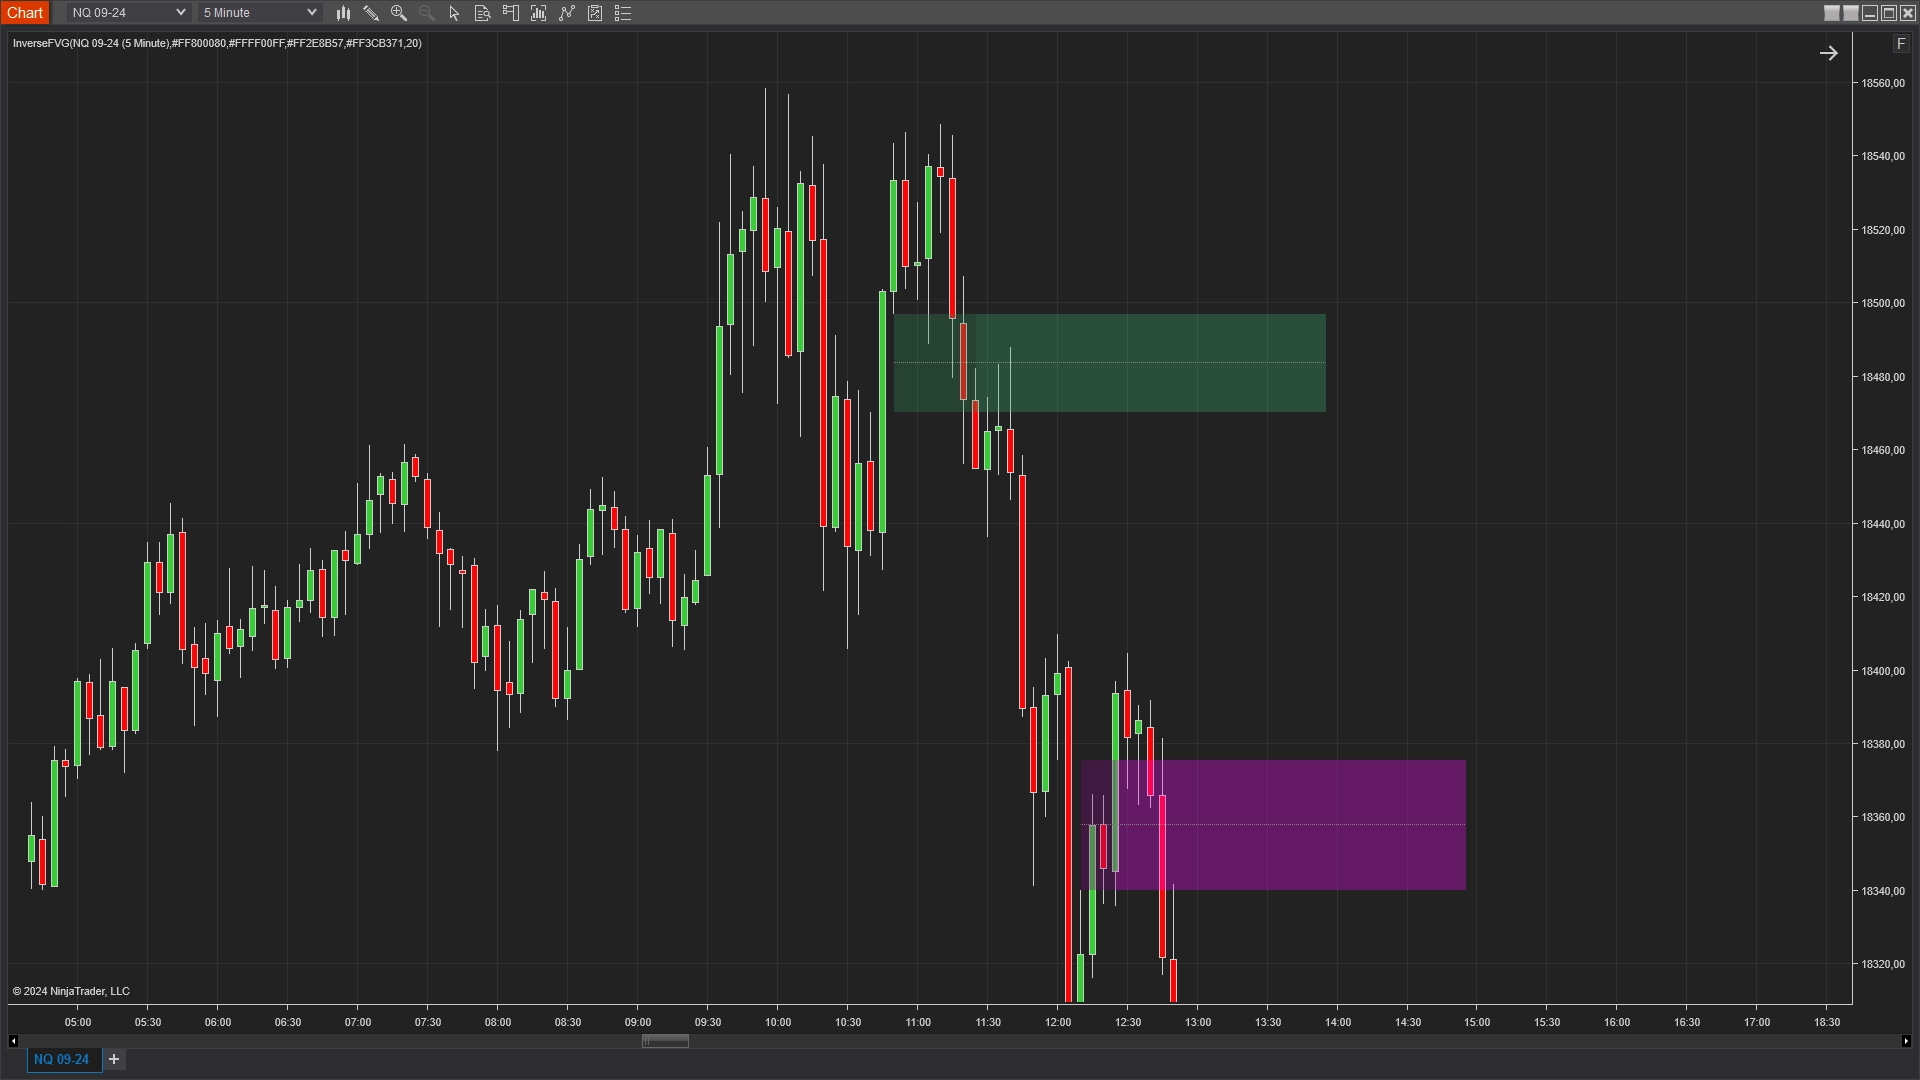
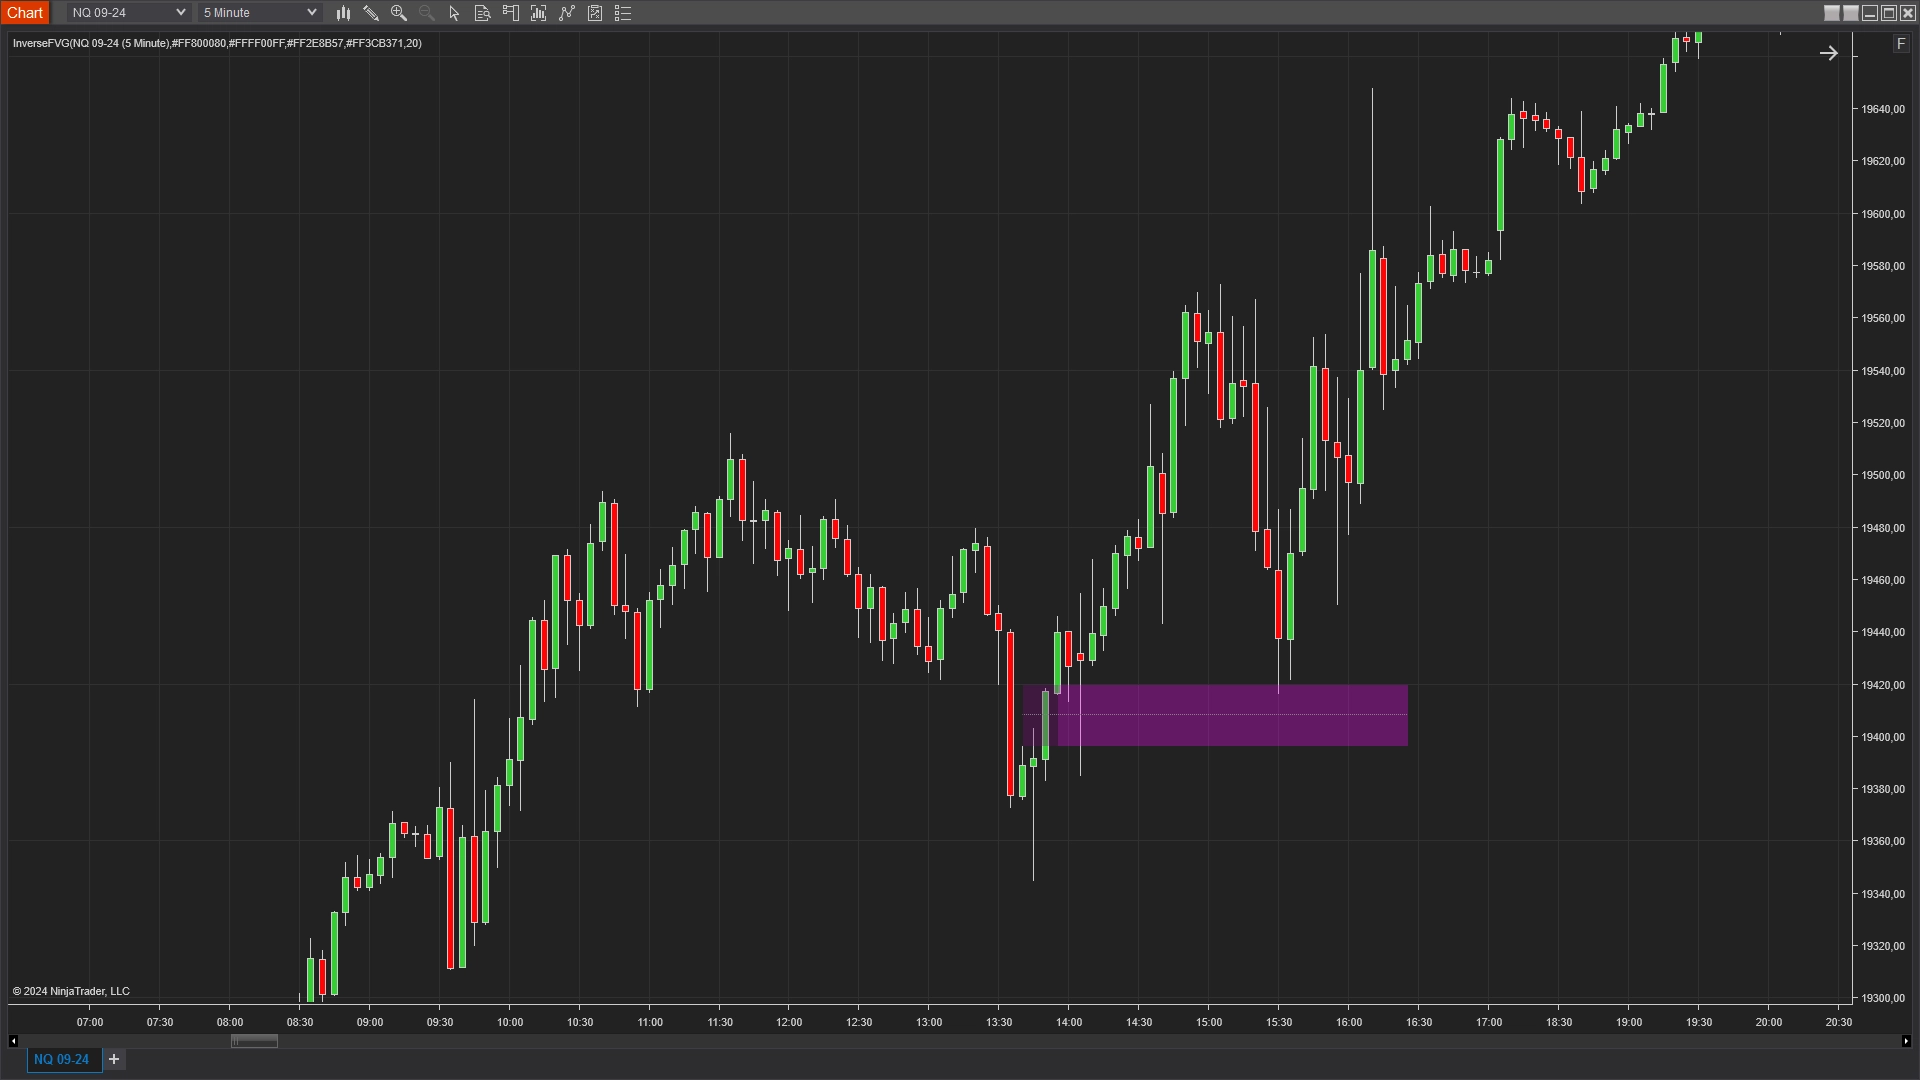
Inverse Fair Value Gap Indicator
Identify and capitalize on market inefficiencies by marking fair value gaps (FVGs) on the chart that meet predefined size criteria. This powerful tool distinguishes between bullish and bearish gaps and changes their color once they are inversed. By doing so, it provides clear visual cues for potential rejection trades from these gaps, making it an essential tool for sophisticated trading strategies.
- Accurate Detection of Fair Value Gaps.
- Automatically identifies and marks fair value gaps that meet specific size requirements. Differentiates between bullish and bearish gaps with distinct visual markers.
- Clear Visualization.
- Draws fair value gaps directly on your chart, making it easy to identify areas of potential market inefficiency.
- Dynamic Color Changes for Inversed Gaps.
- Changes the color of the gap once the price trades through it, indicating the gap is now inversed and providing a signal for potential trading opportunities.
- Immediate Feedback.
- Provides immediate visual feedback on the status of each gap, helping you make informed trading decisions in real-time.
- Support and Resistance Levels.
- Marks key support and resistance levels created by fair value gaps, aiding in strategic decision-making.
- Flexible Configuration.
- Allows you to customize the appearance and behavior of the indicator to suit your trading style and preferences.
Gain a Competitive Edge with Comprehensive Market Session Analysis
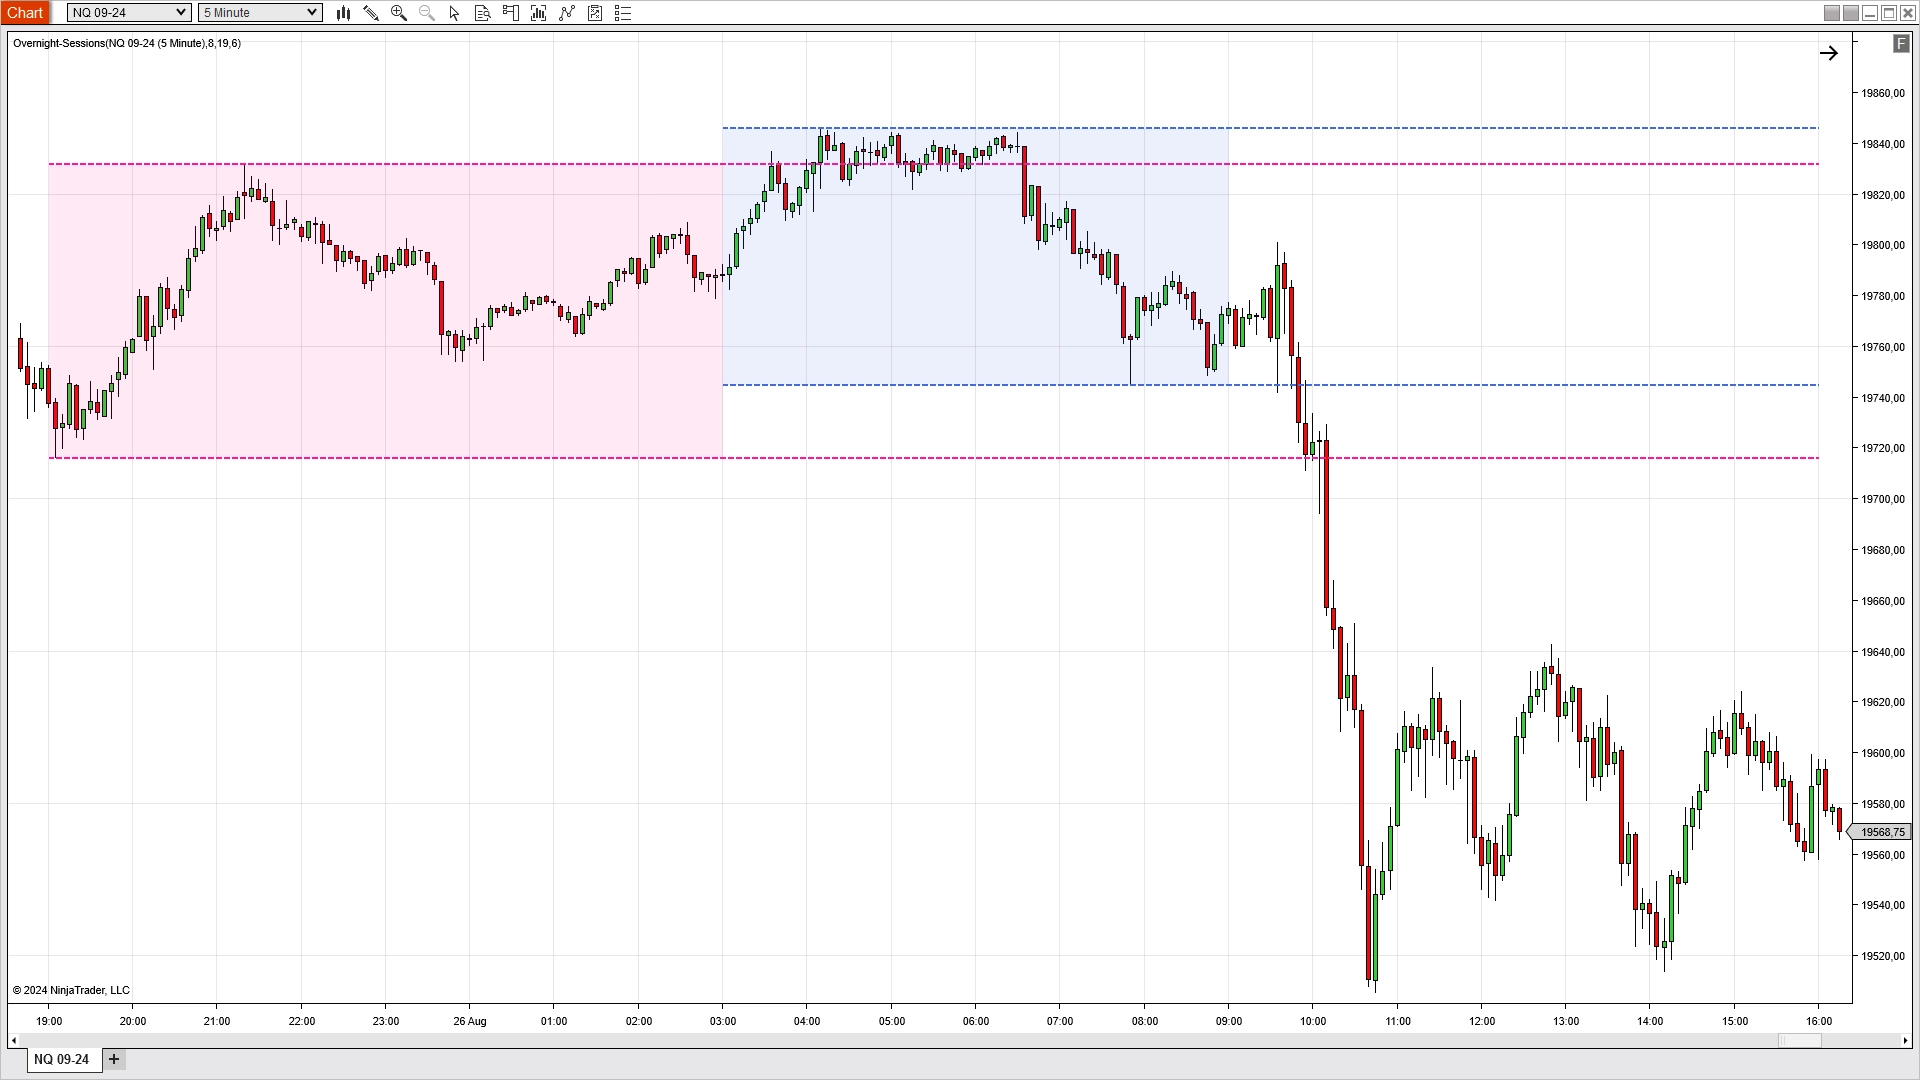
Overnight Sessions Indicator
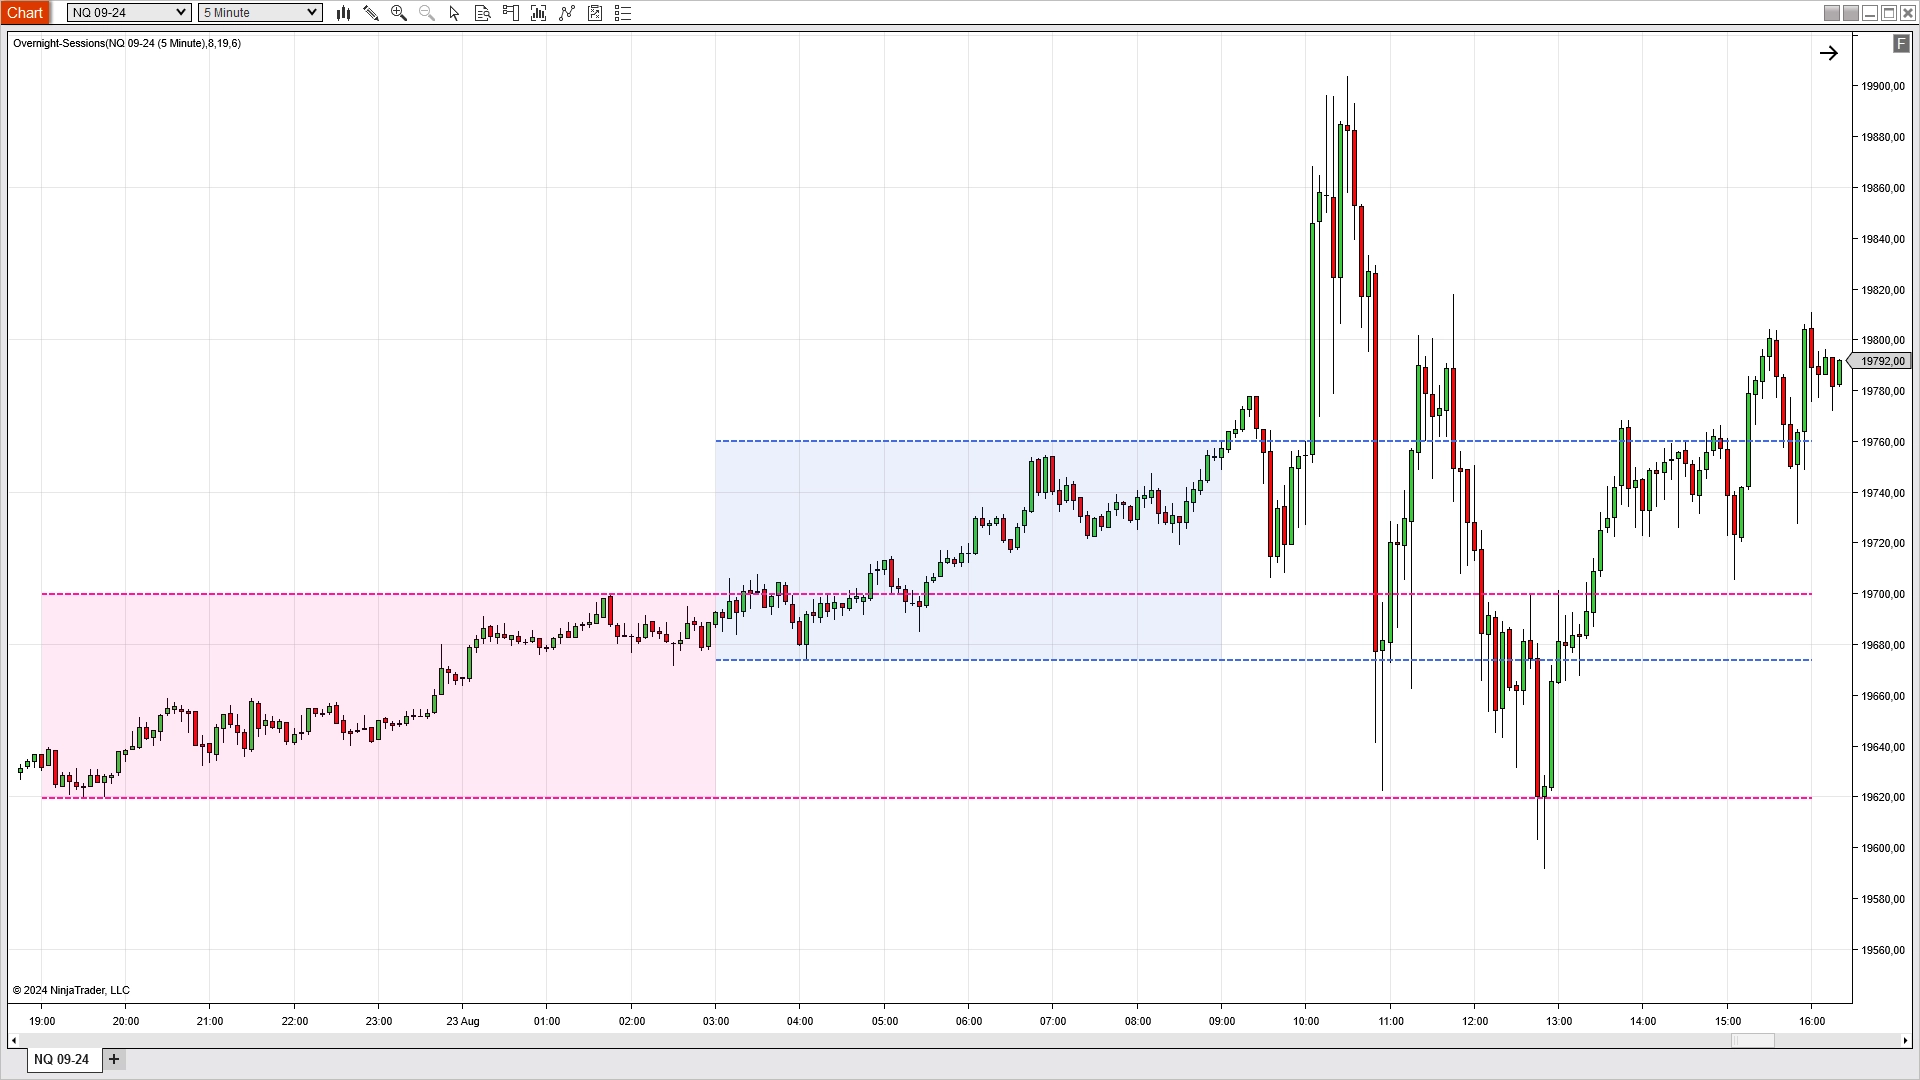
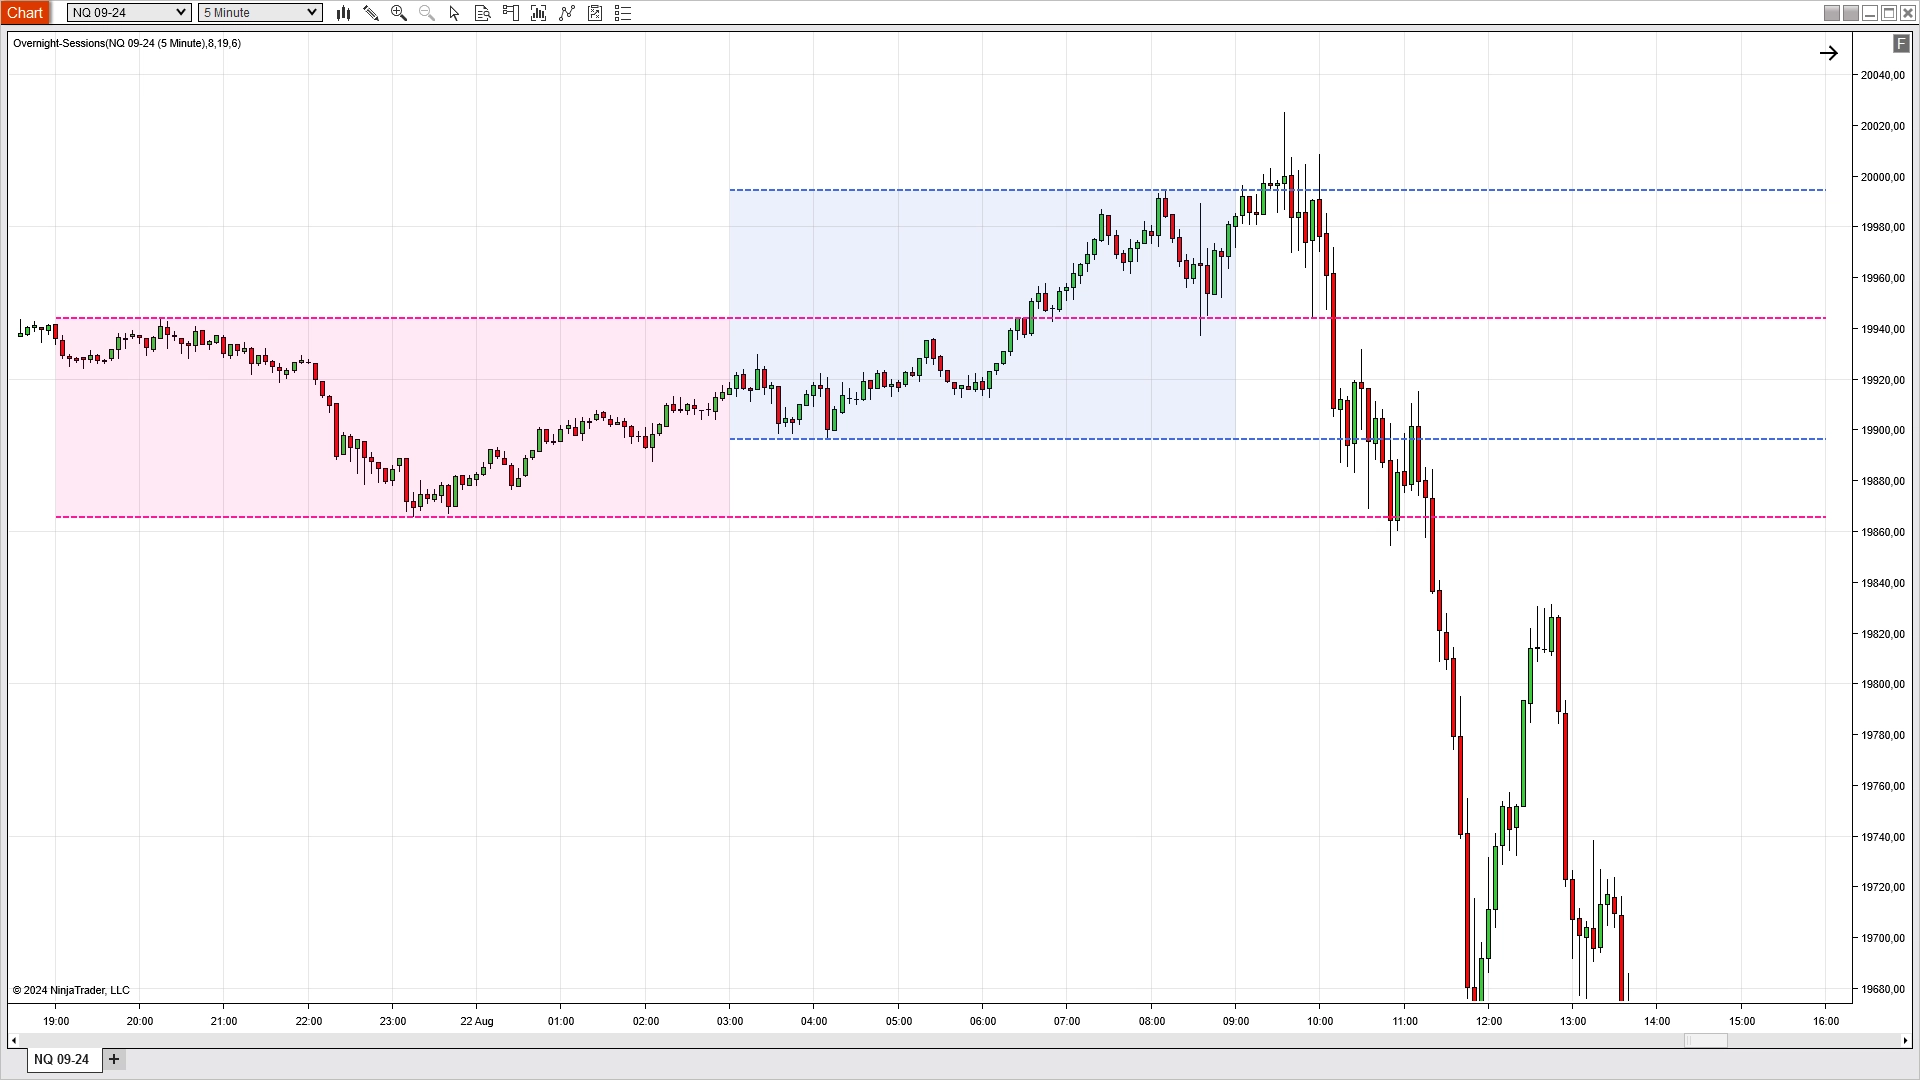
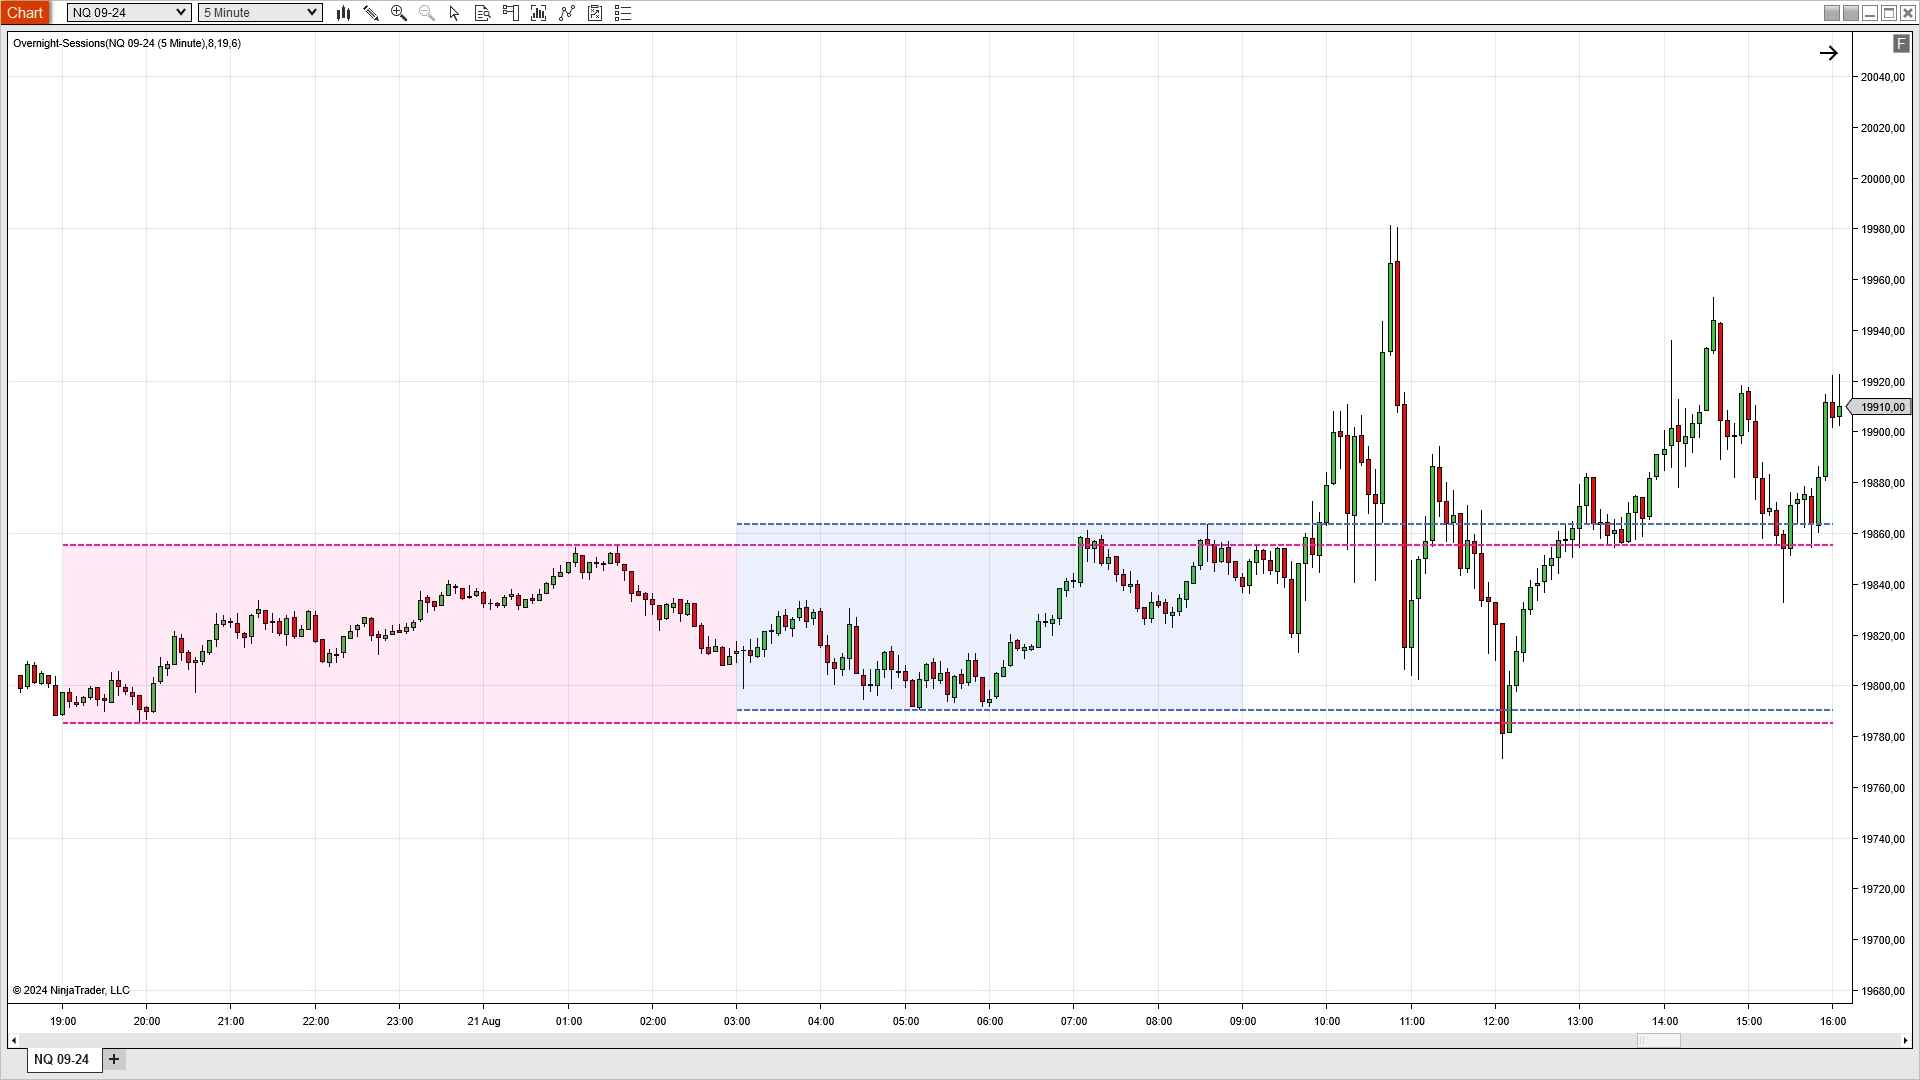
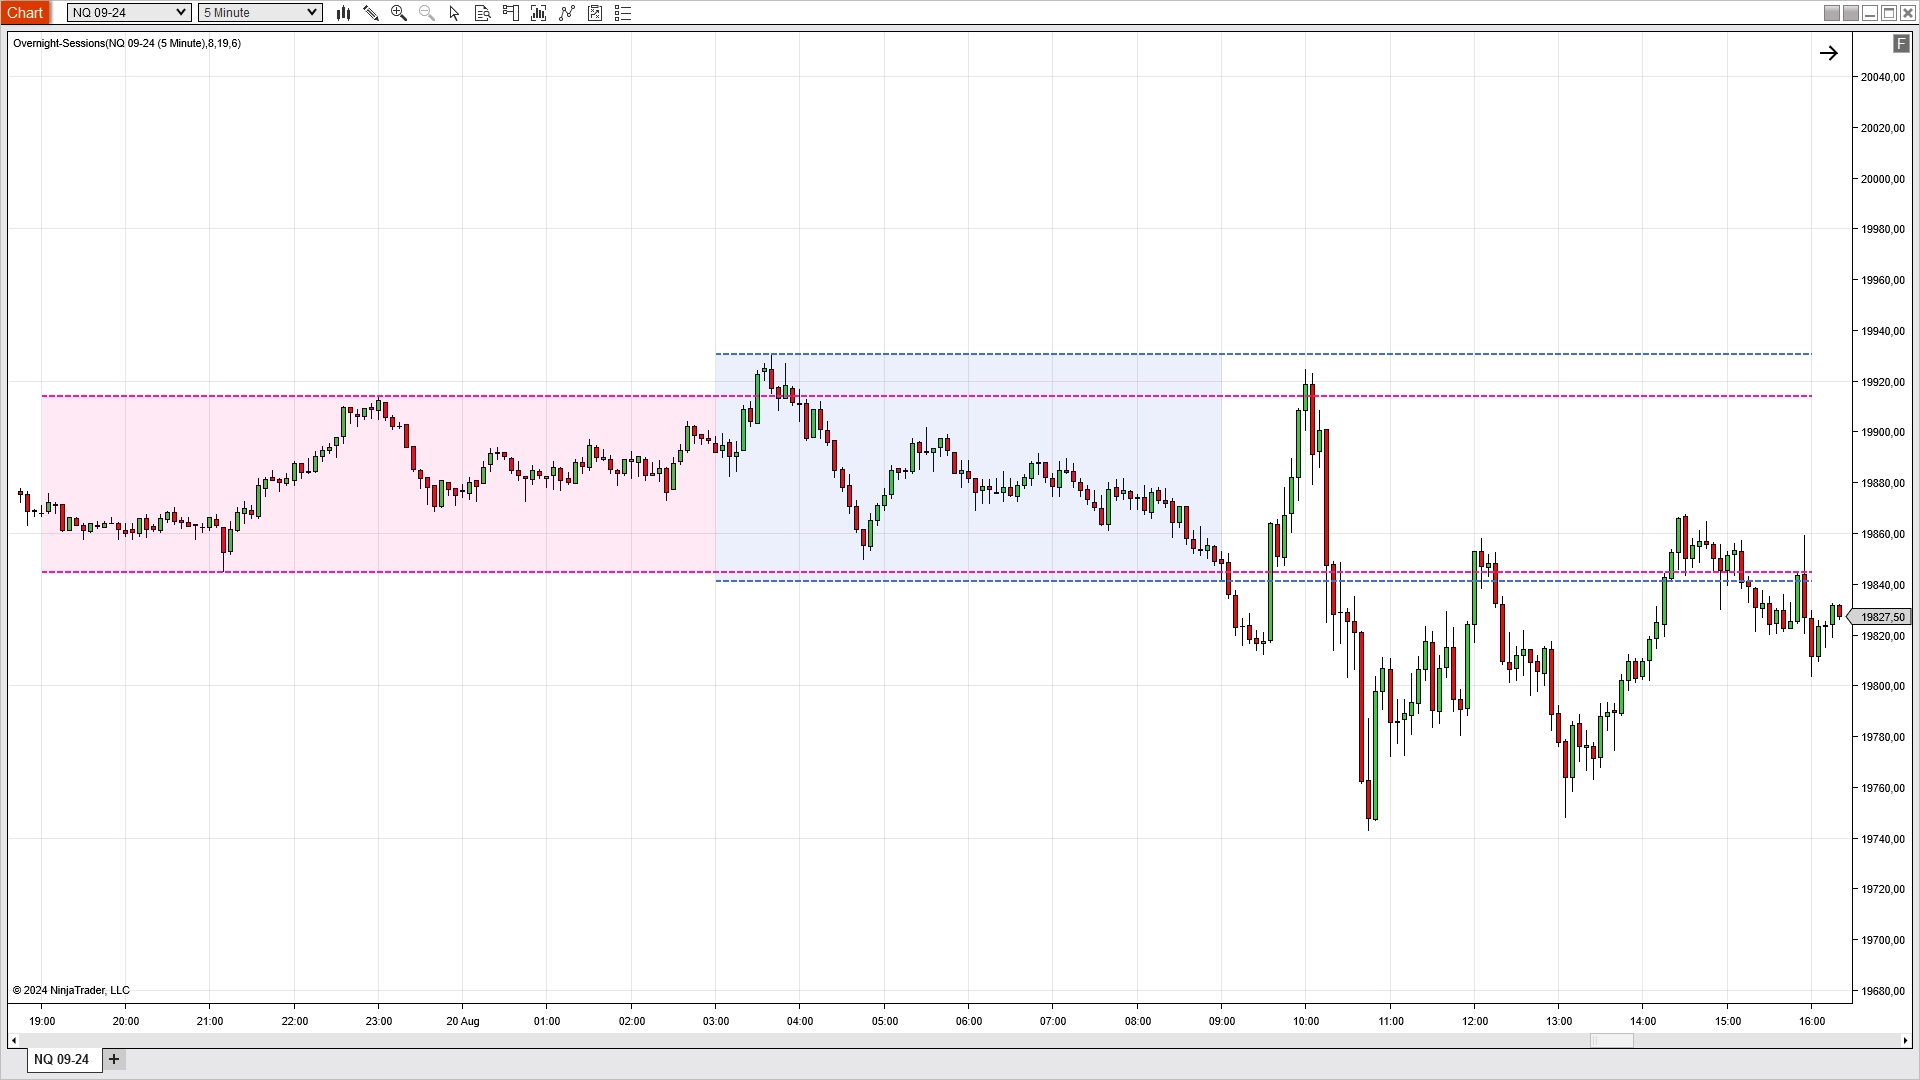
Enhance your trading strategy by visually delineating the Asia and London trading sessions on your charts. This powerful tool highlights the start and end times of these sessions, marks the high and low points, and extends these levels until the end of the New York regular trading session. By using this indicator, traders can gain valuable insights into market behavior and make more informed trading decisions.
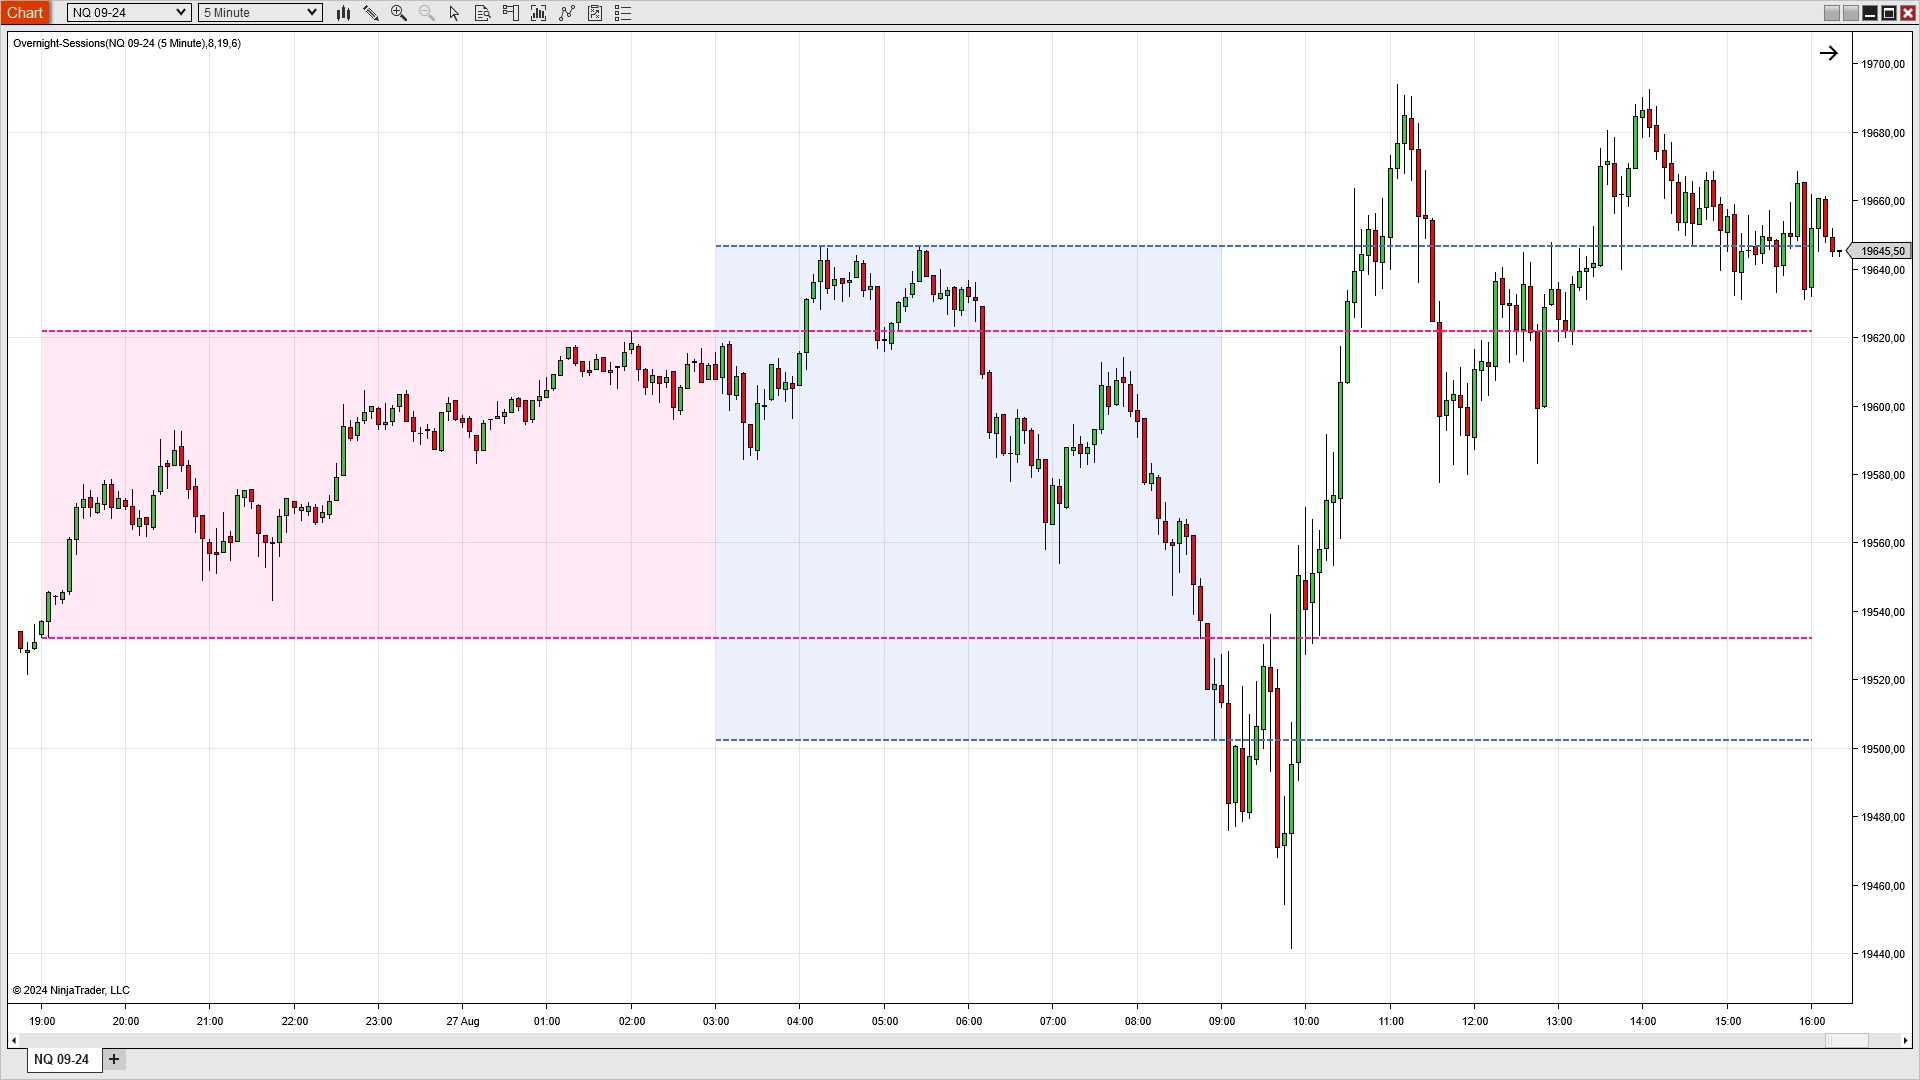
- Session Highs and Lows.
- Automatically marks the high and low points of the Asia and London sessions.
- Extension Until New York Close.
- Extends the high and low levels of the Asia and London sessions until the end of the regular New York trading session.
- Flexible Configuration.
- Allows you to customize the appearance and behavior of the indicator to match your trading preferences.
- Session Trends.
- Helps you identify trends and potential reversal points within and following the Asia and London sessions.
- Support and Resistance.
- Uses the extended high and low levels as potential support and resistance zones during the New York session.
- Color-Coded Sessions.
- Uses distinct colors for each session to enhance visual clarity and quick identification.
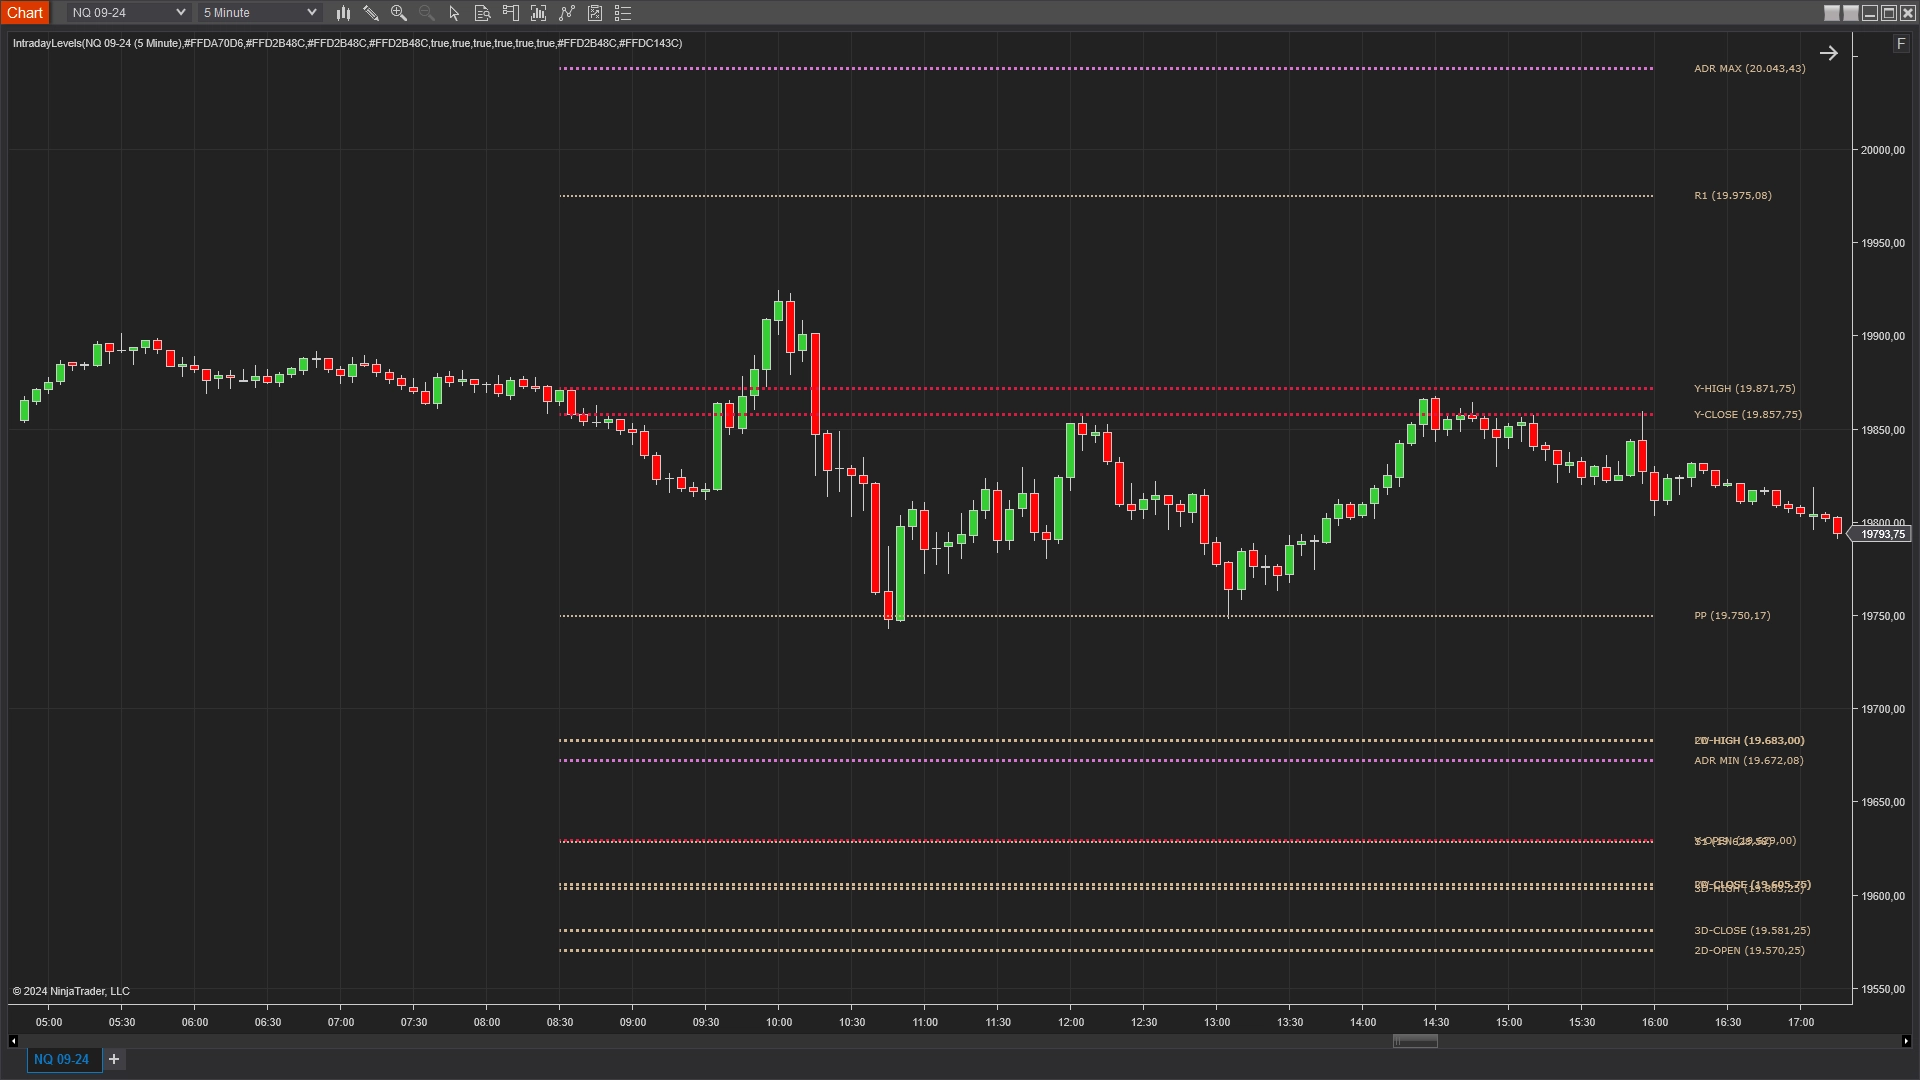
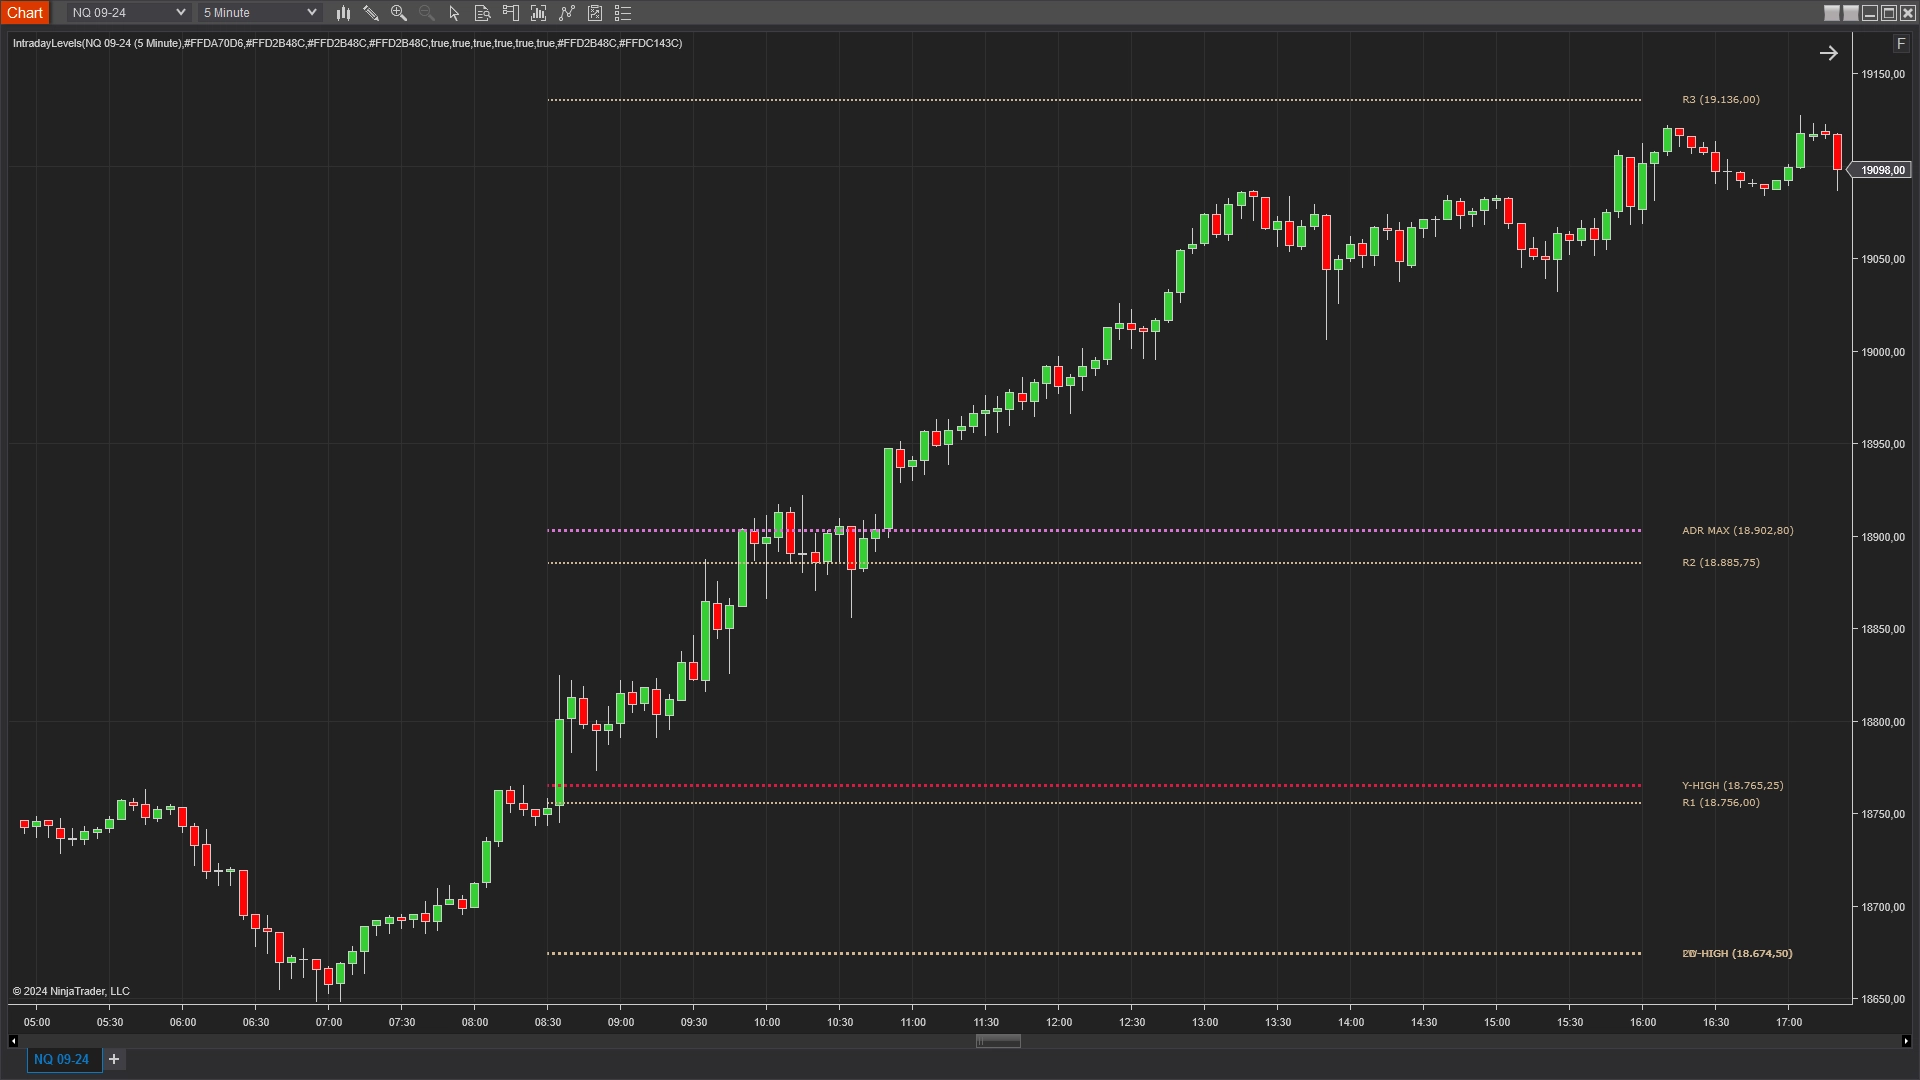
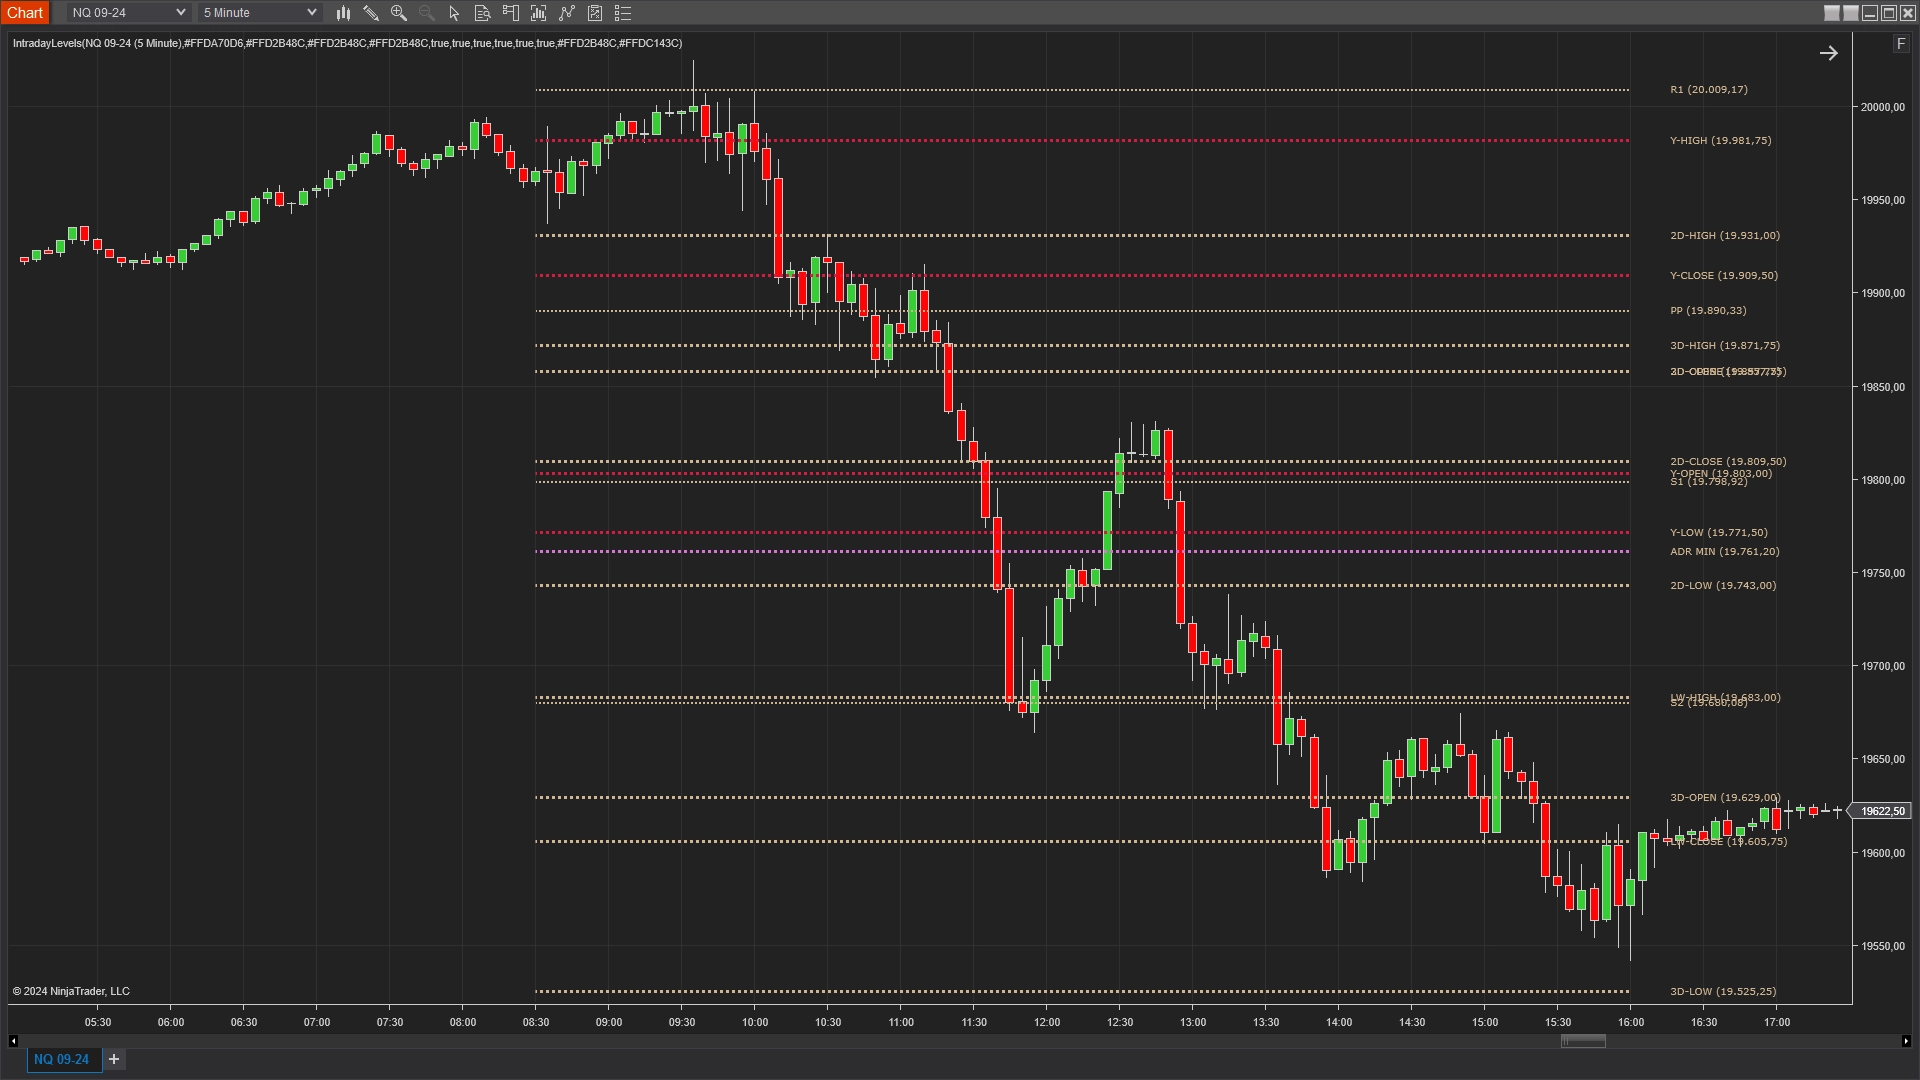
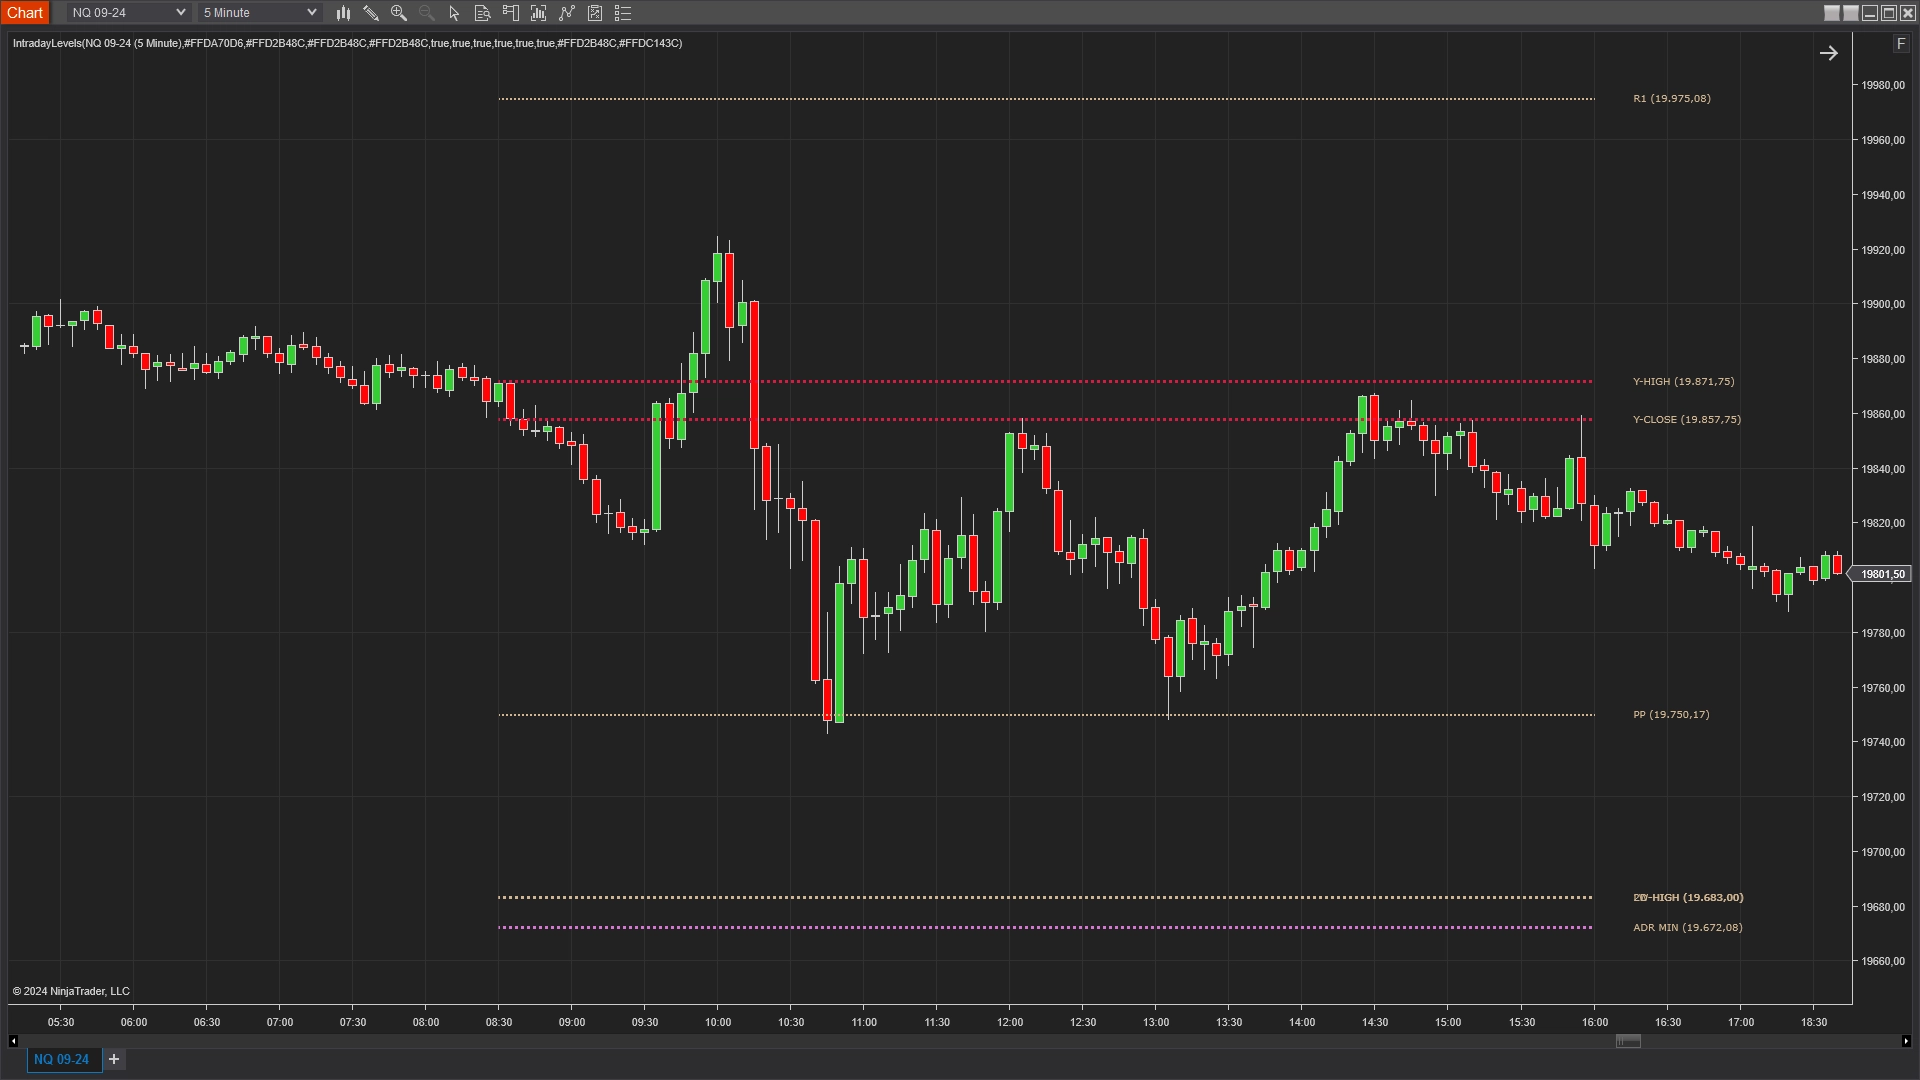
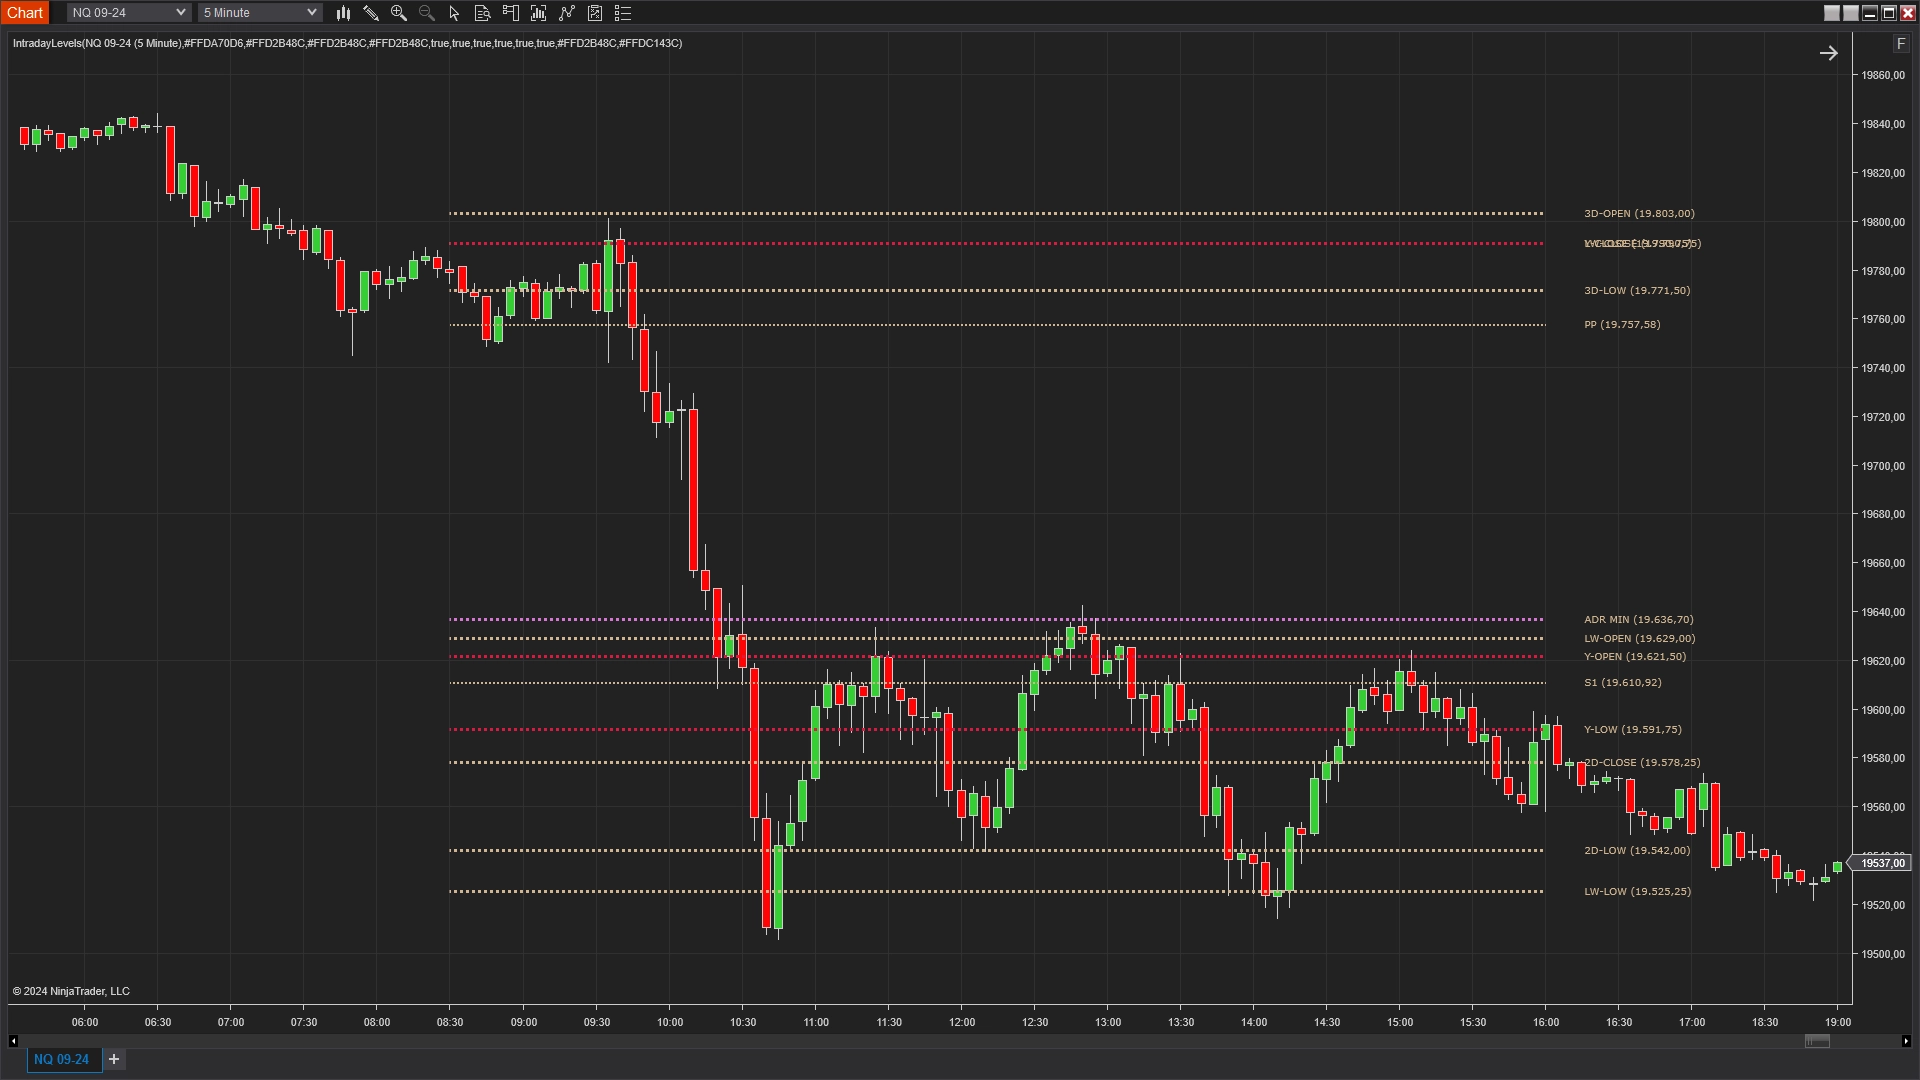
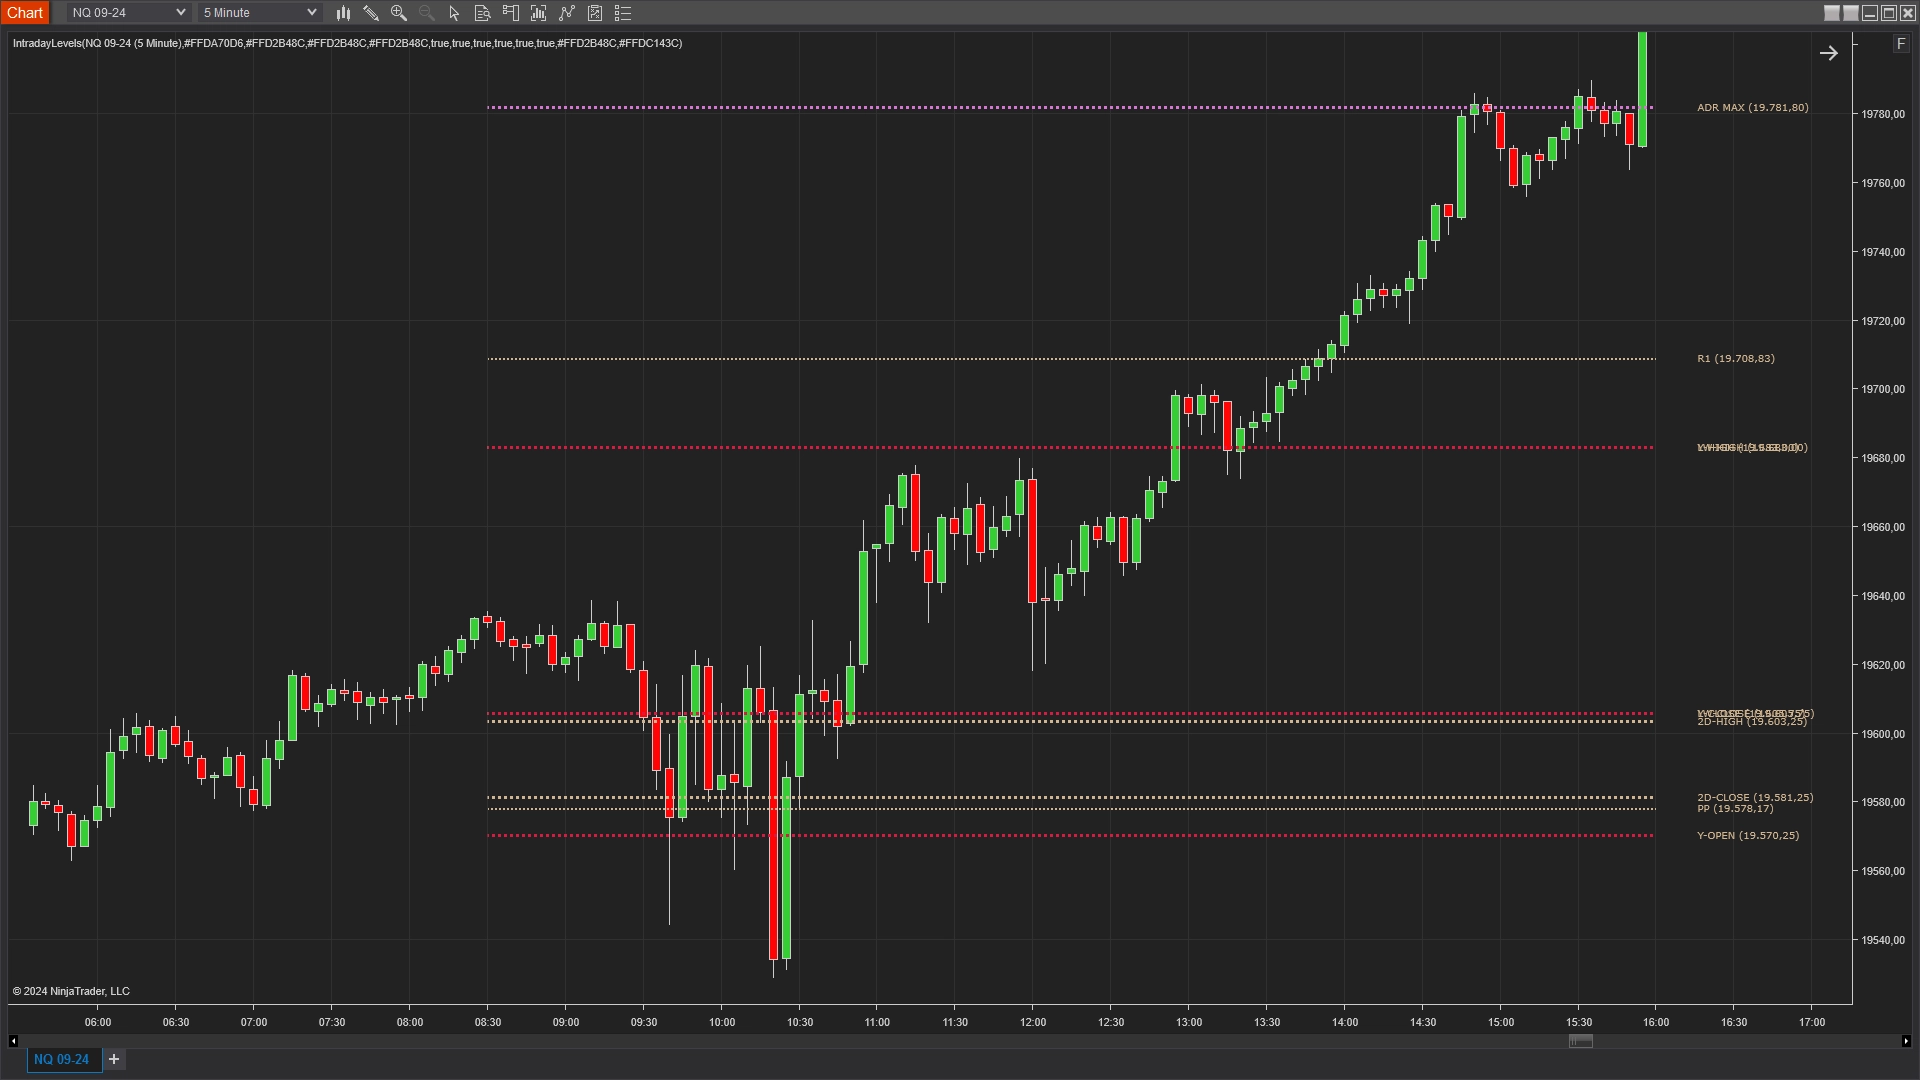
Enhance Your Trading Precision with Critical Intraday Levels
Intraday Levels Indicator
Our custom "Intraday Levels" Indicator is designed to provide traders with a comprehensive view of crucial intraday levels. By automatically drawing horizontal lines for significant price levels, such as ADR (Average Daily Range) min and max values, yesterday’s open, high, low, and close, pivot points (S1, S2, S3 and R1, R2, R3), and weekly open, high, low, and close levels, this indicator offers valuable insights to help you make more informed trading decisions.
- ADR Min and Max Values.
- Automatically calculates and draws the ADR min and max values for the current session. Helps you understand the expected trading range and potential volatility for the day.
- Yesterday's Levels.
- Marks the previous trading session's open, high, low, and close prices. Provides key reference points for assessing market behavior and potential reversal zones.
- Pivot Points.
- Draws pivot points including S1, S2, S3 (support levels) and R1, R2, R3 (resistance levels). Aids in identifying potential support and resistance zones, trend reversals, and breakout points.
- Weekly Levels.
- Marks the open, high, low, and close prices of the current week. Offers a wider context for understanding market trends and key levels over the week.
- Comprehensive Market Analysis.
- Helps you identify significant intraday trends and potential reversal points by highlighting critical price levels. Utilizes key levels as support and resistance points to inform your trading decisions.
- Backtesting and Performance Evaluation.
- Enables you to backtest the indicator against historical data to validate its effectiveness and refine your strategies.
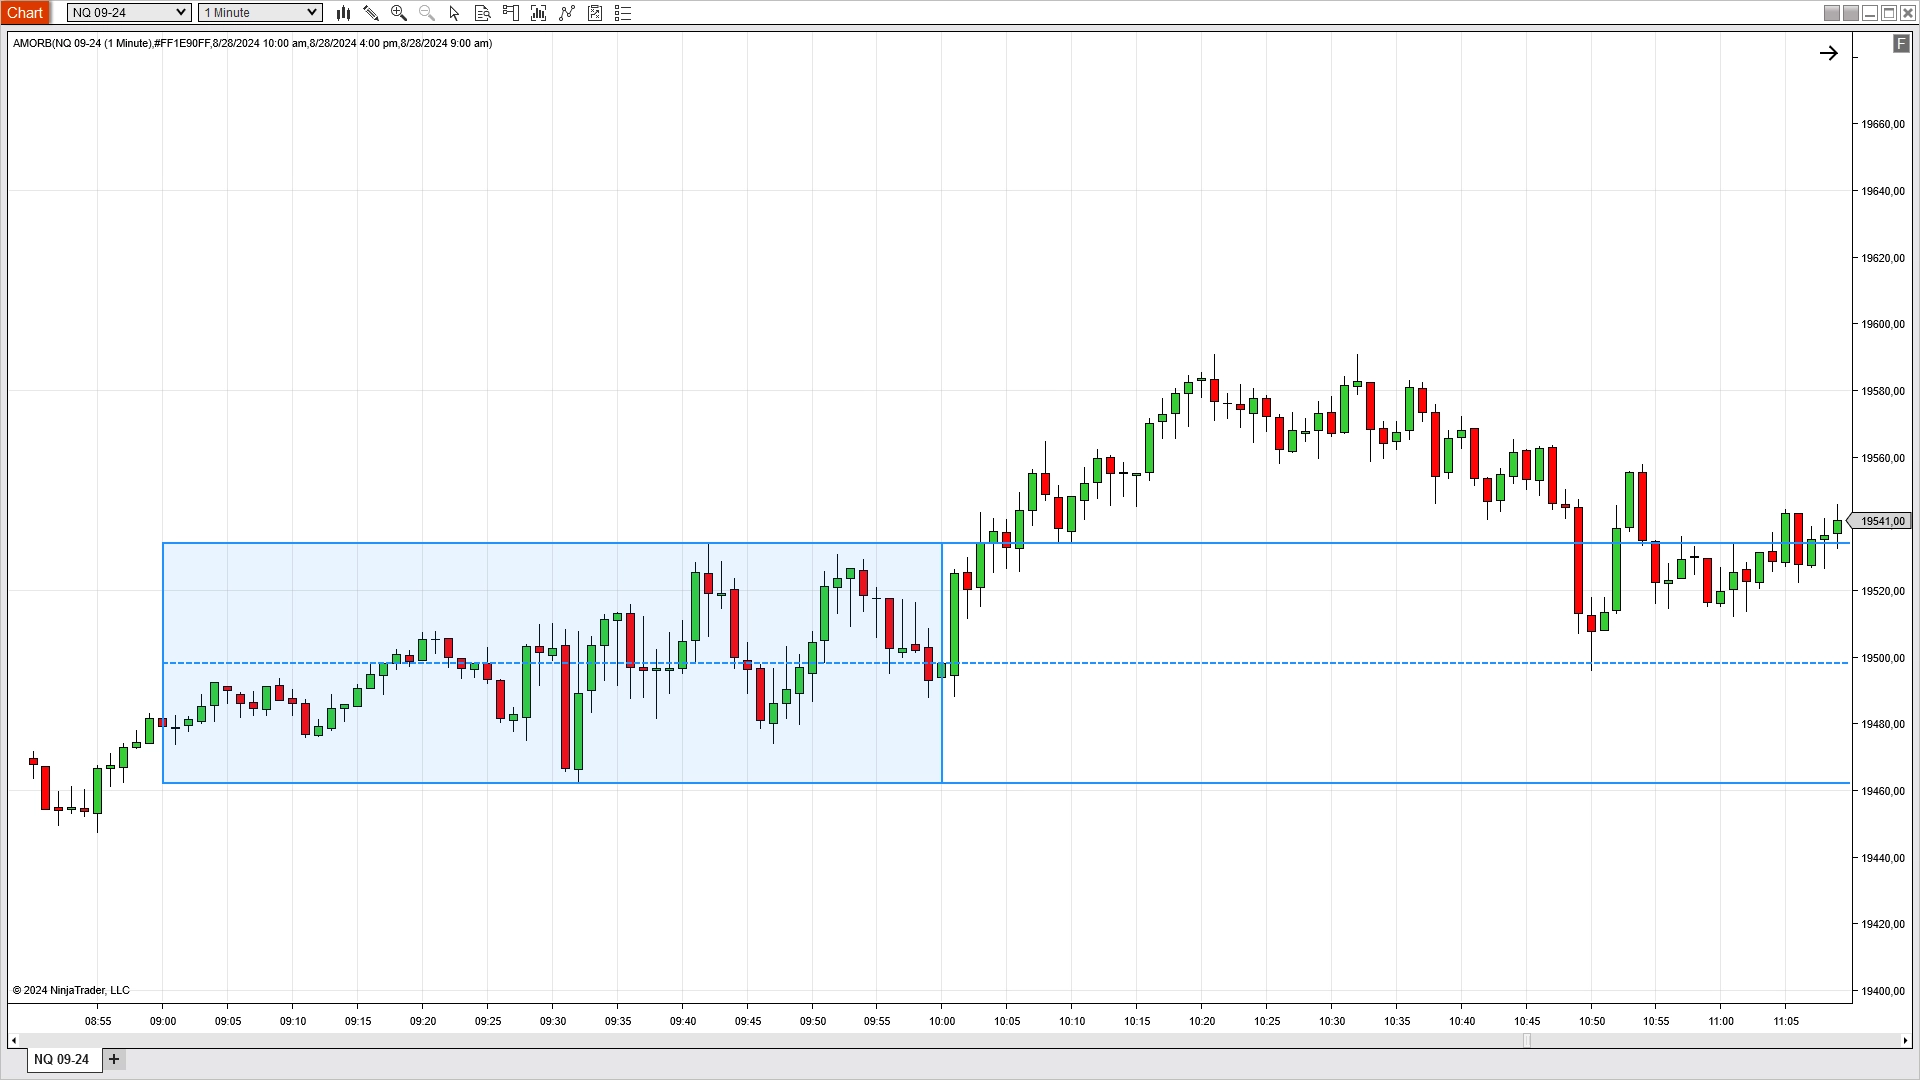
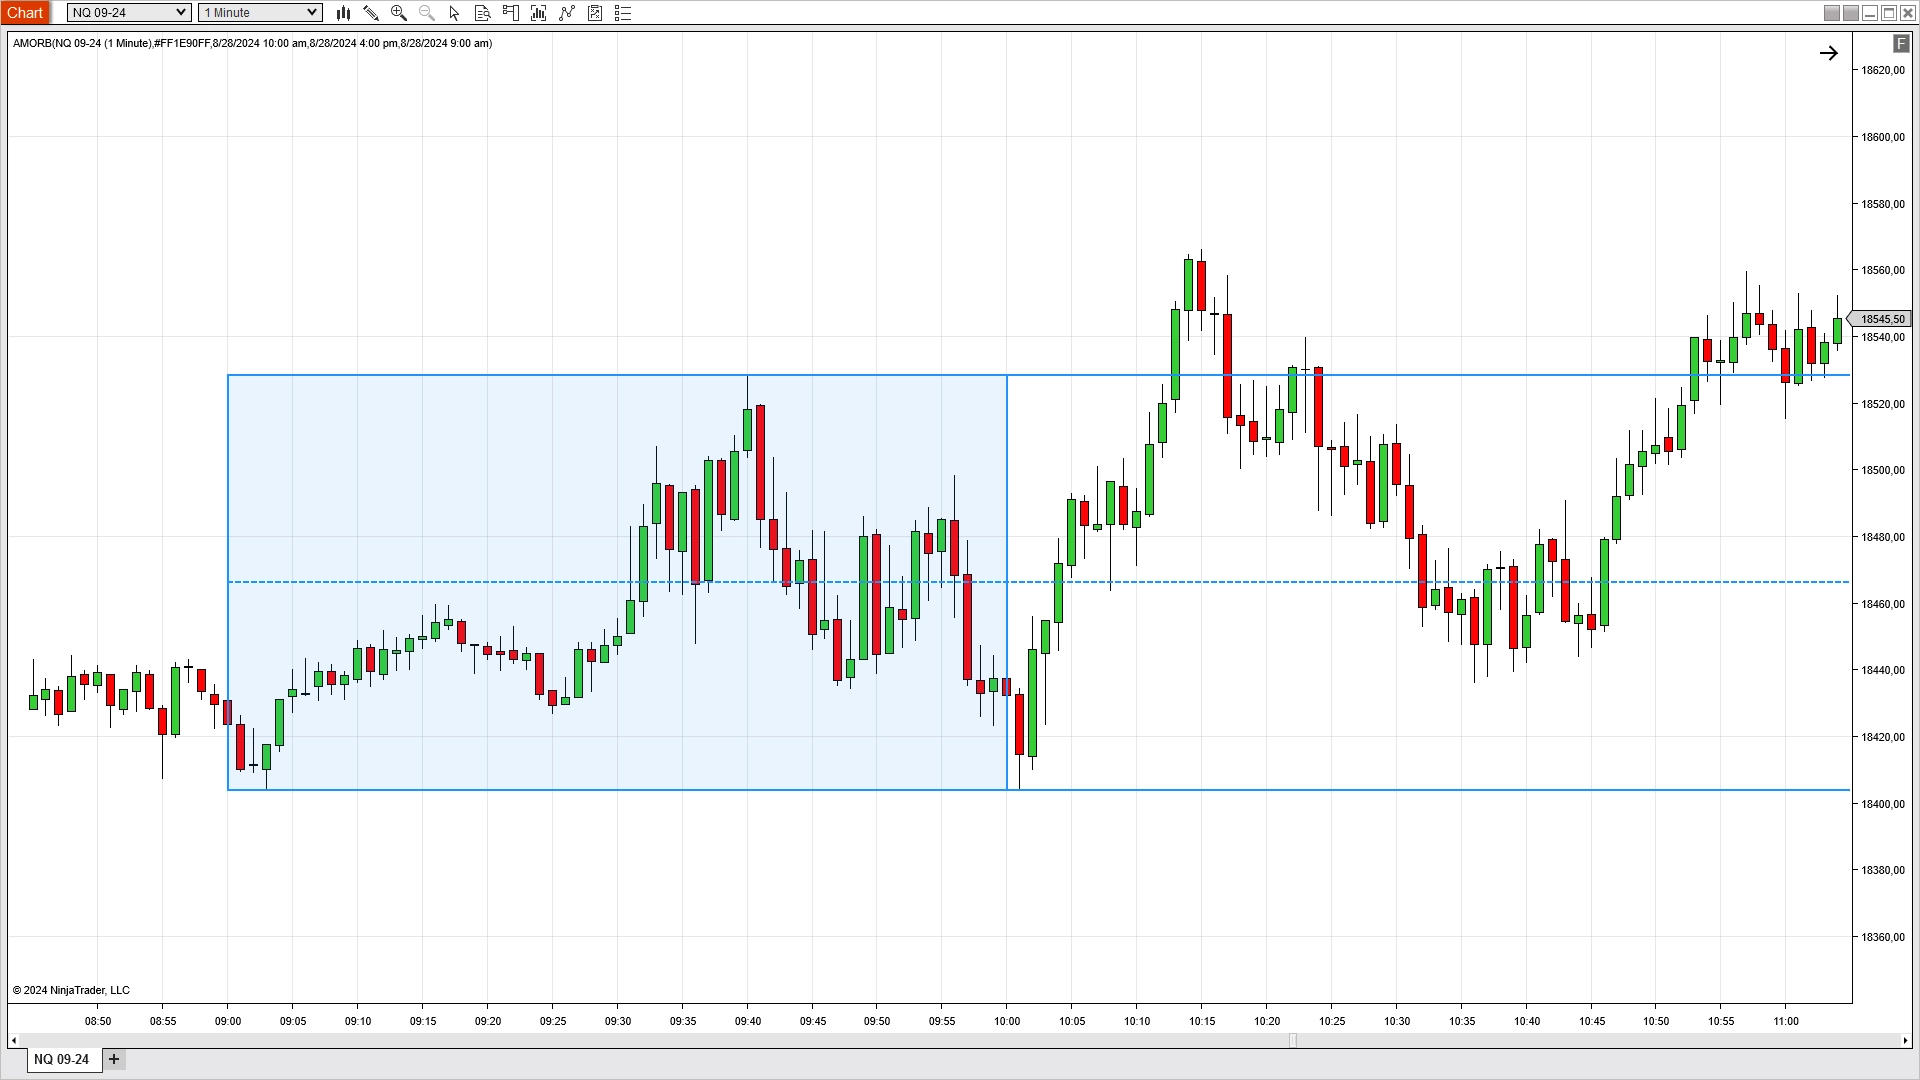
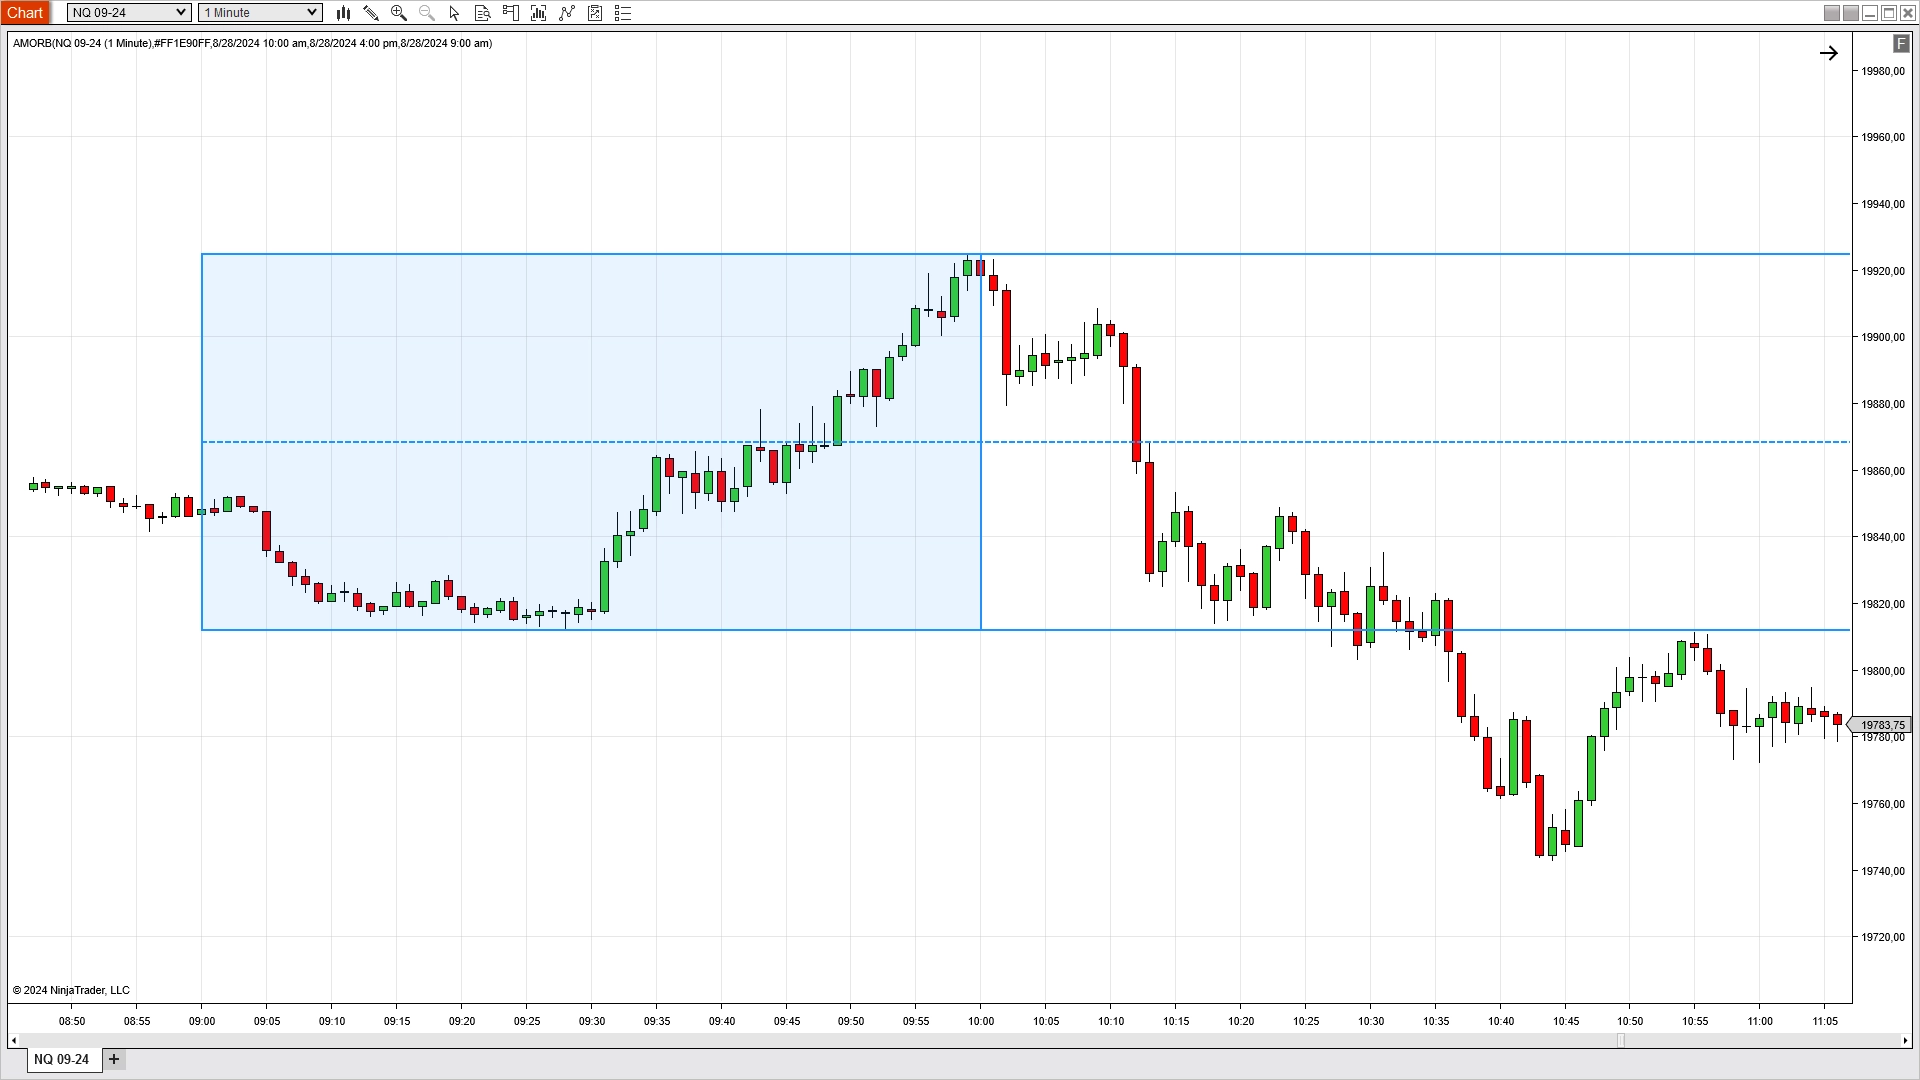
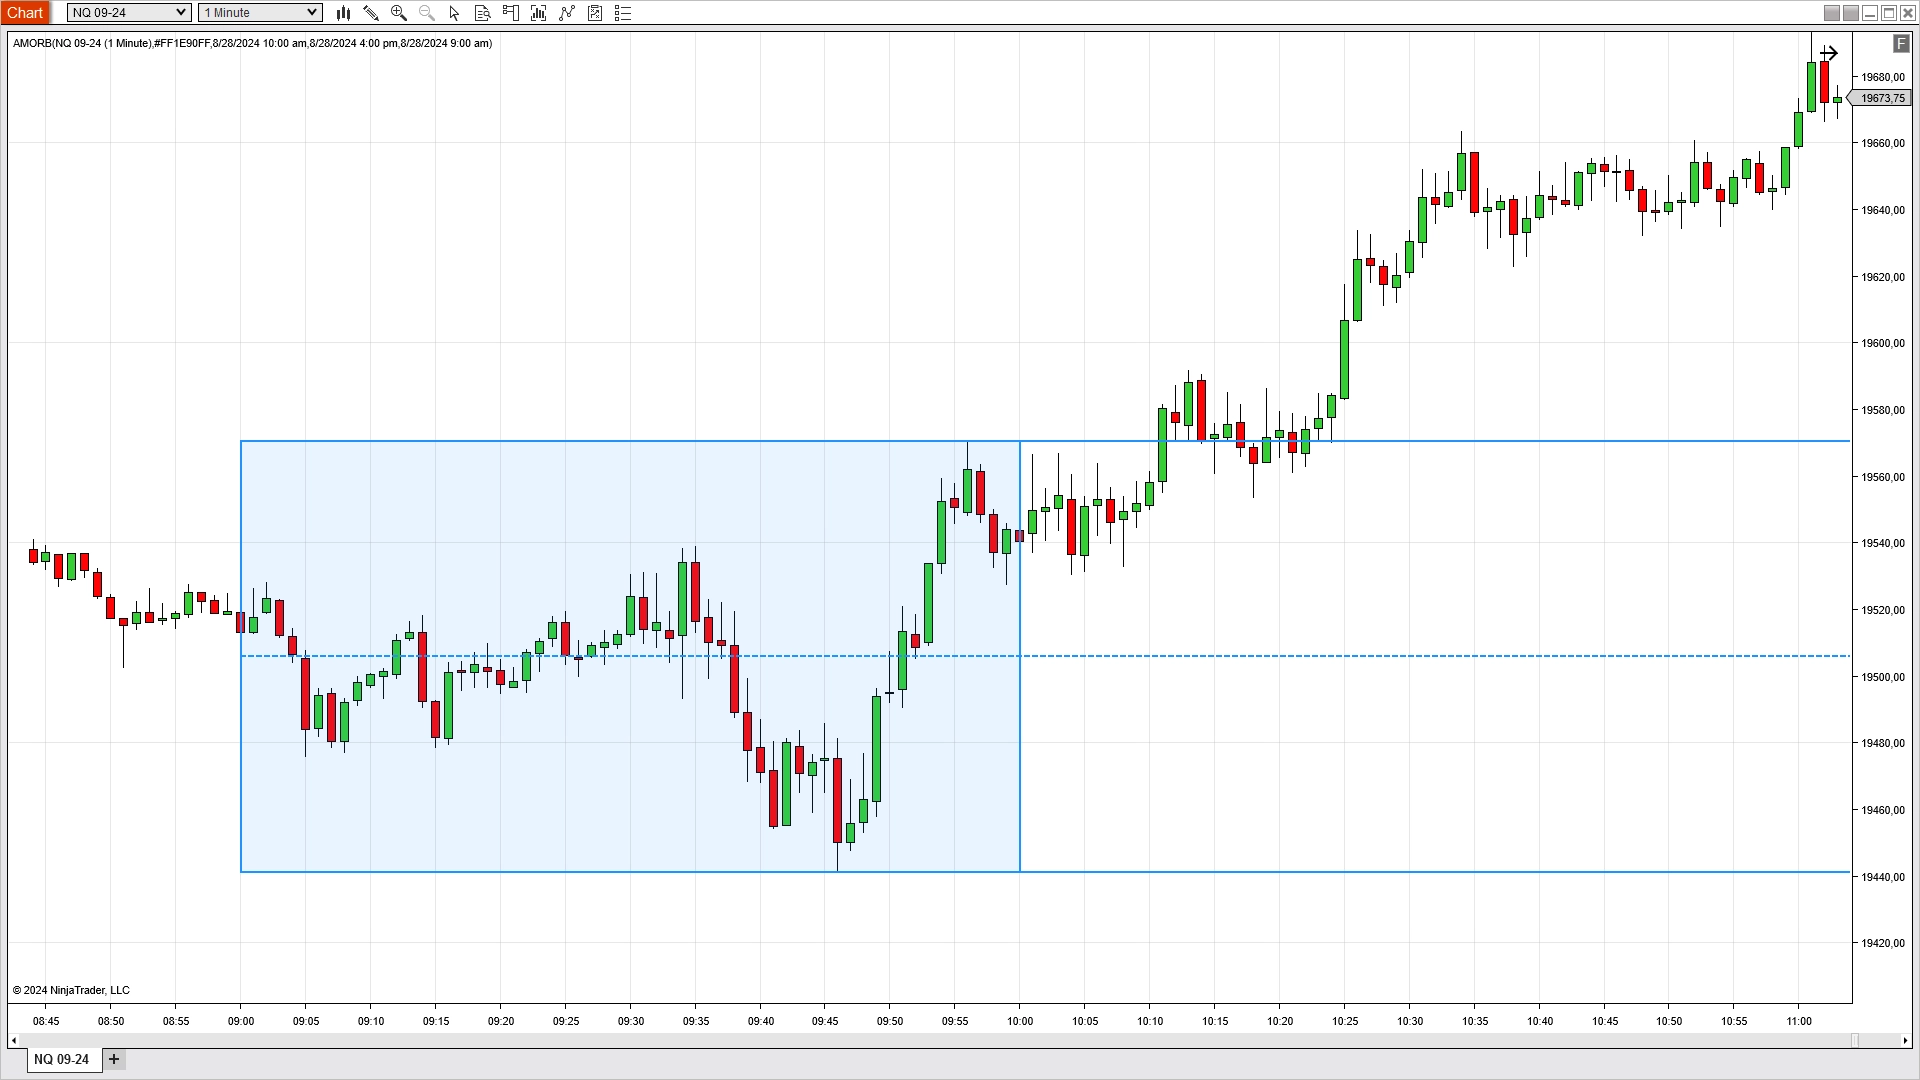
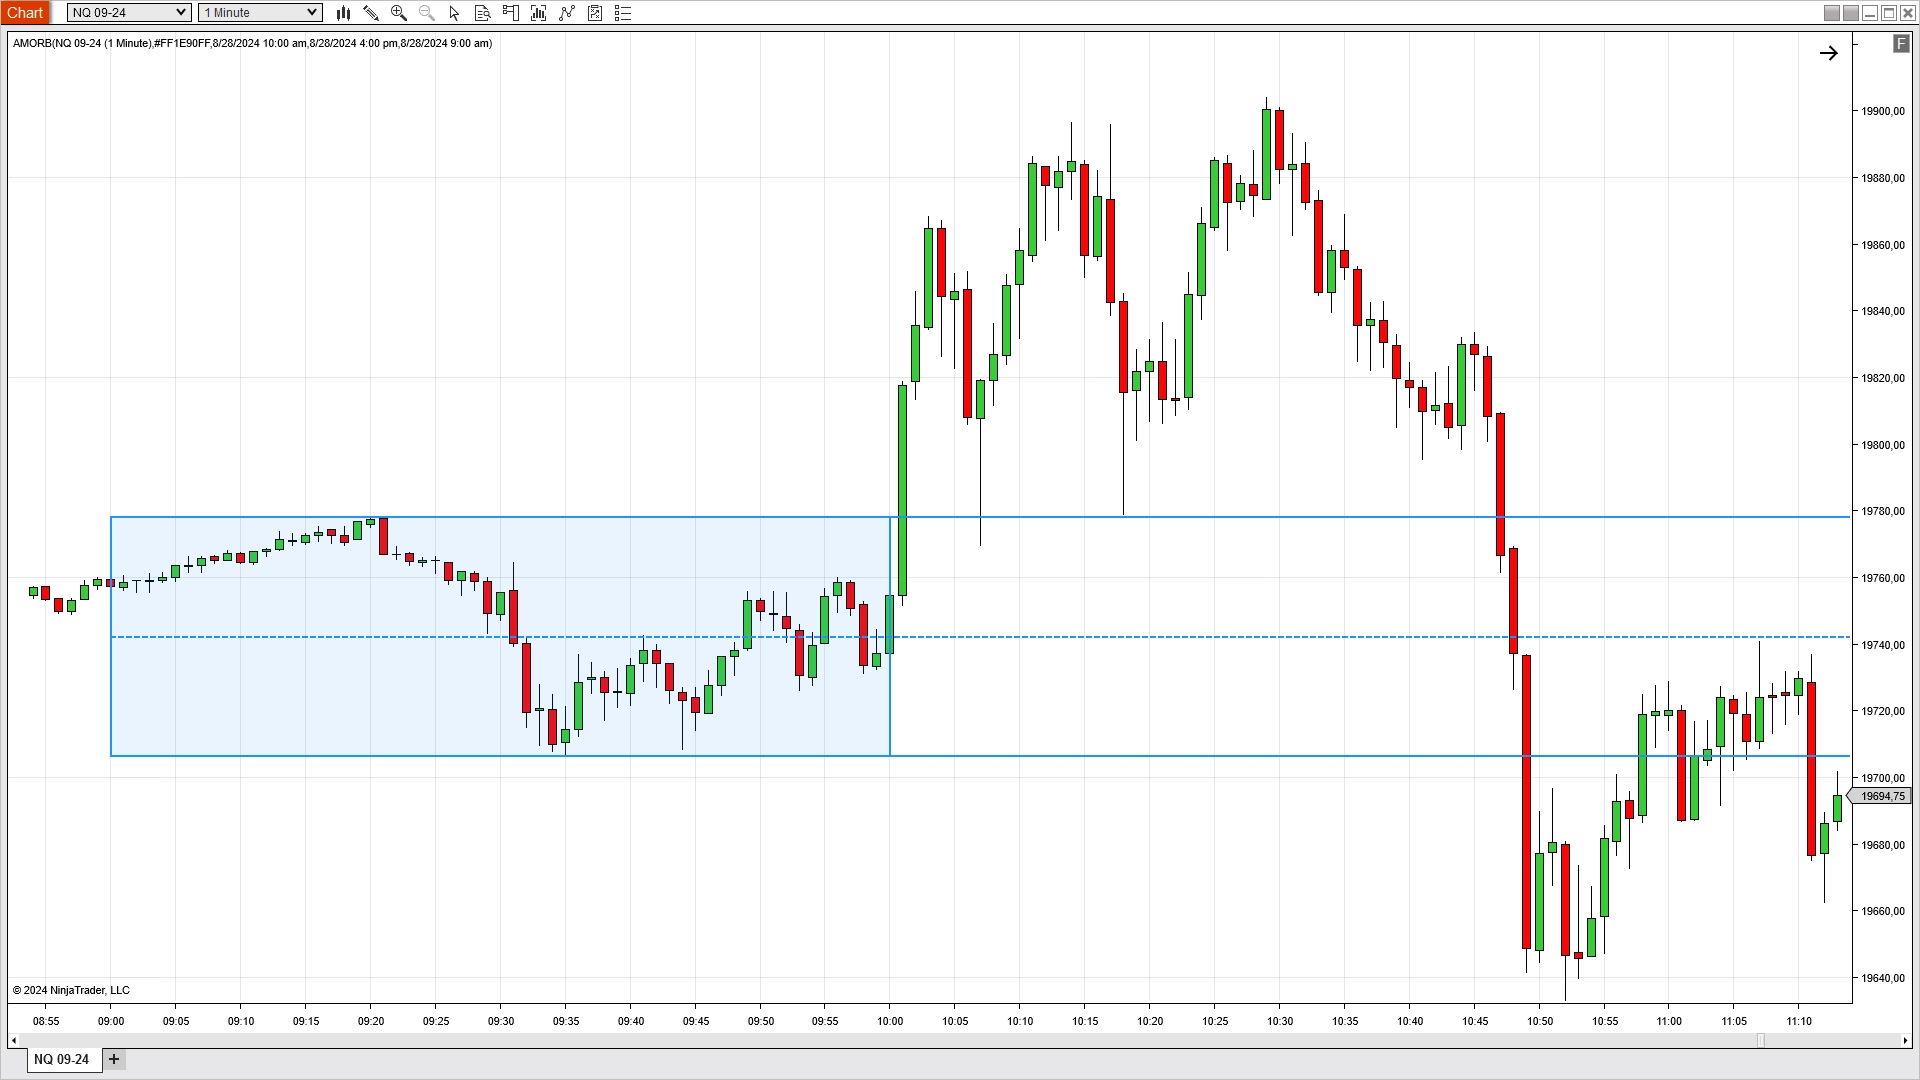
Master the Market Open with Precise Range Analysis
AM ORB Indicator
Capitalize on the critical opening hour of the trading day. By marking the high and low range from 8-9 AM, drawing a box around this range, and extending these levels along with the midpoint throughout the session, this indicator provides valuable insights into market dynamics right after the open. Traders can use this information to strategize around the rejection or acceptance of these levels, making it an essential tool for day trading.
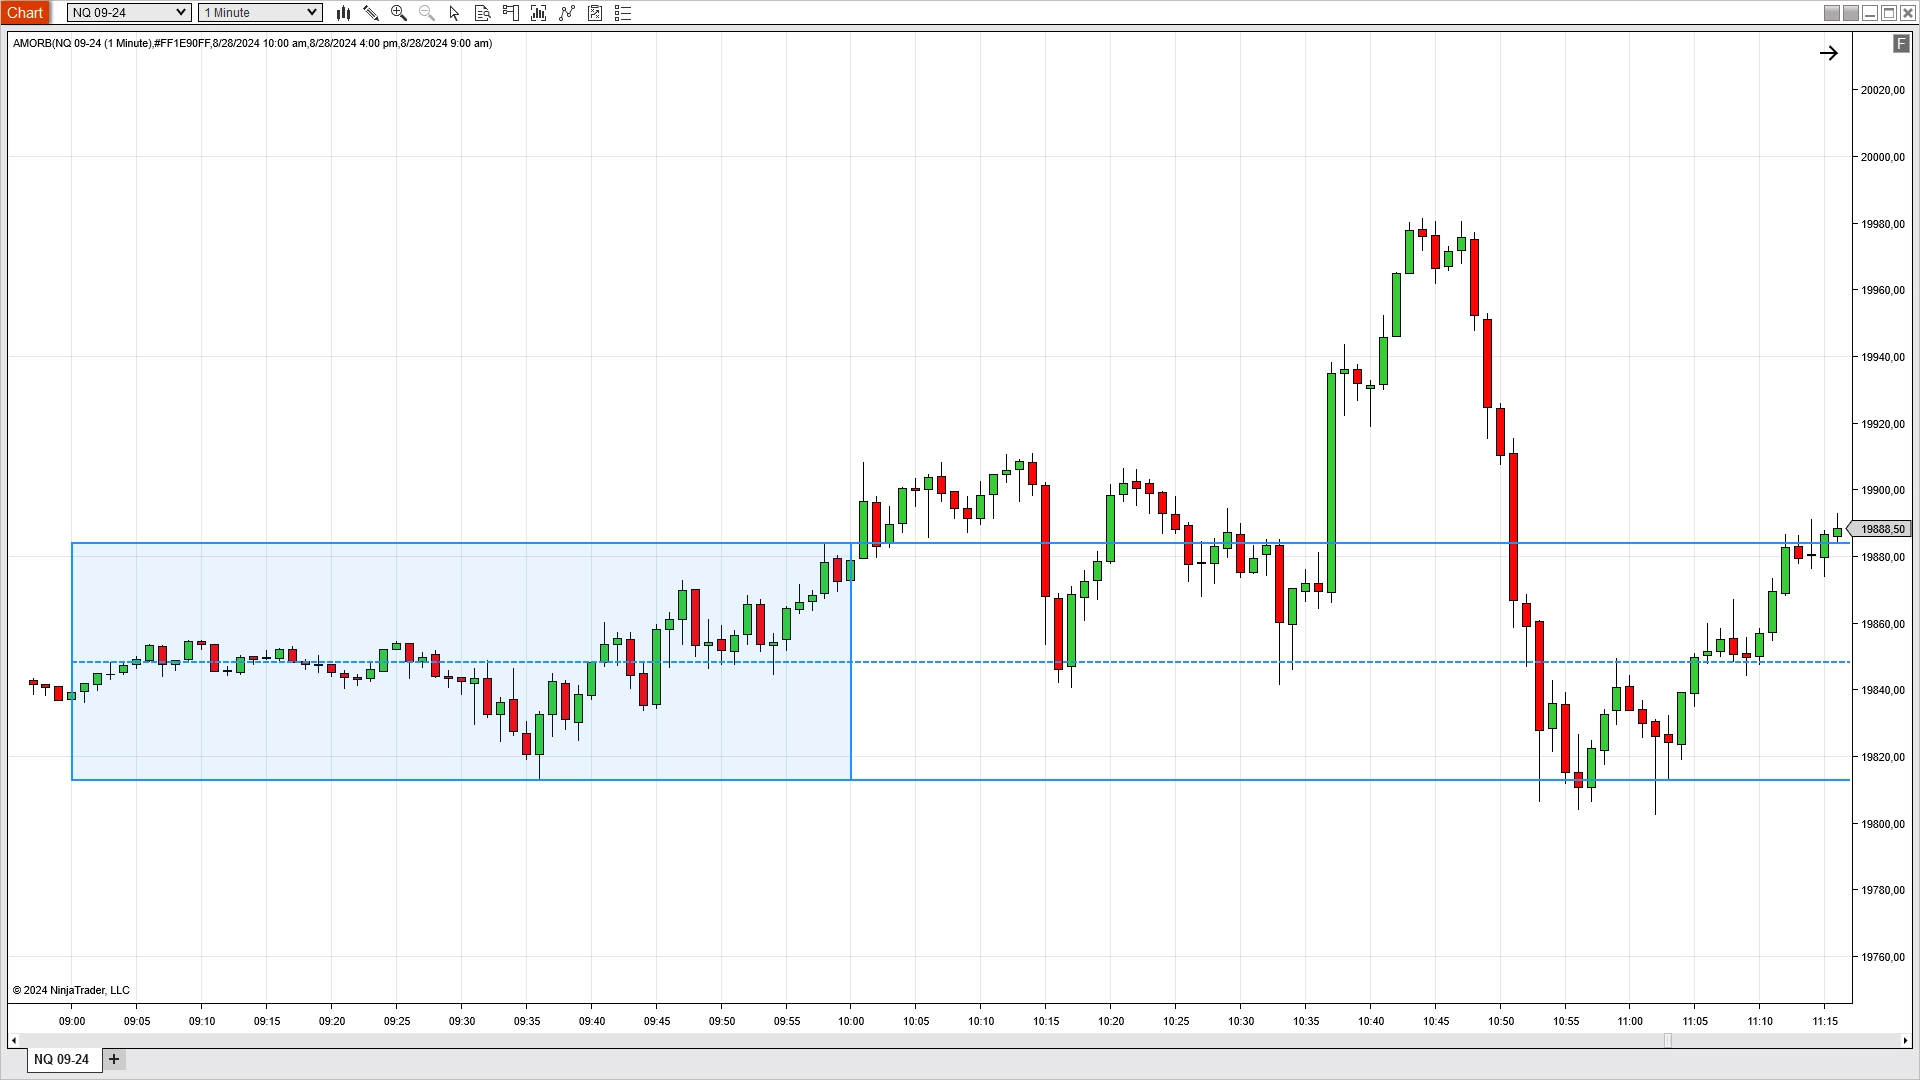
- 8-9 AM Range Marking.
- Automatically identifies and marks the high and low points of the 8-9 AM trading range. Draws a clear box around the identified range, making it easy to see on your charts.
- Extended Levels Throughout the Session.
- Extends the high and low levels of the 8-9 AM range throughout the entire trading session. Calculates and extends the midpoint of the 8-9 AM range, providing an additional reference level.
- Rejection Plays.
- Use the indicator to identify potential rejection points at the high, low, or midpoint, allowing you to trade reversals.
- Acceptance and Continuation Plays.
- Analyze price acceptance beyond these levels to trade continuations, capturing trends that develop after the range break.
- Support and Resistance Levels.
- Utilizes the extended high, low, and midpoint as critical support and resistance levels for informed trading decisions.
- Flexible Configuration.
- Allows you to customize the appearance and behavior of the indicator to suit your trading style and preferences.
Pricing
The right price for you,
whoever you are
Select from our range of options — whether you need a single indicator, the complete bundle, or a license change. Get the tools you need to enhance your trading strategy, all at competitive prices.
Single Indicator
Get the specific indicator you need to elevate your trading. Choose from our selection of custom tools to match your unique trading style.
NinjaTrader 8 or later is required to run our indicators.
- 1 Indicator
- 1 Installation
- Lifetime usage
Complete Bundle
Maximize your market edge with our complete indicator bundle. Access all 4 powerful tools at a special price for comprehensive trading insights.
NinjaTrader 8 or later is required to run our indicators.
- 4 Indicators
- 1 Installation
- Lifetime usage
Change Machine ID
Easily transfer your indicator license to a new machine or after a system update. Just provide your new Machine ID — a small fee of $10 applies for each license change.
Risk Disclosure
Futures and forex trading contains substantial risk and is not for every investor. An investor could potentially lose all or more than the initial investment. Risk capital is money that can be lost without jeopardizing ones’ financial security or life style. Only risk capital should be used for trading and only those with sufficient risk capital should consider trading. Past performance is not necessarily indicative offuture results.
Hypothetical Performance Disclosure
Hypothetical performance results have many inherent limitations, some of which are described below. No representation is being made that any account will or is likely to achieve profits or losses similar to those shown; in fact, there are frequently sharp differences between hypothetical performance results and the actual results subsequently achieved by any particular trading program. One of the limitations of hypothetical performance results is that they are generally prepared with the benefit of hindsight. In addition, hypothetical trading does not involve financial risk, and no hypothetical trading record can completely account for the impact of financial risk of actual trading. for example, the ability to withstand losses or to adhere to a particular trading program in spite of trading losses are material points which can also adversely affect actual trading results. There are numerous other factors related to the markets in general or to the implementation of any specific trading program which cannot be fully accounted for in the preparation of hypothetical performance results and all which can adversely affect trading results.